
In this blog series, we look at 99 common data viz rules and why it’s usually OK to break them.
by Adam Frost
You typically change the design of a chart for one of three reasons:
to make it easier to read
to strengthen the story
to make it more visually appealing
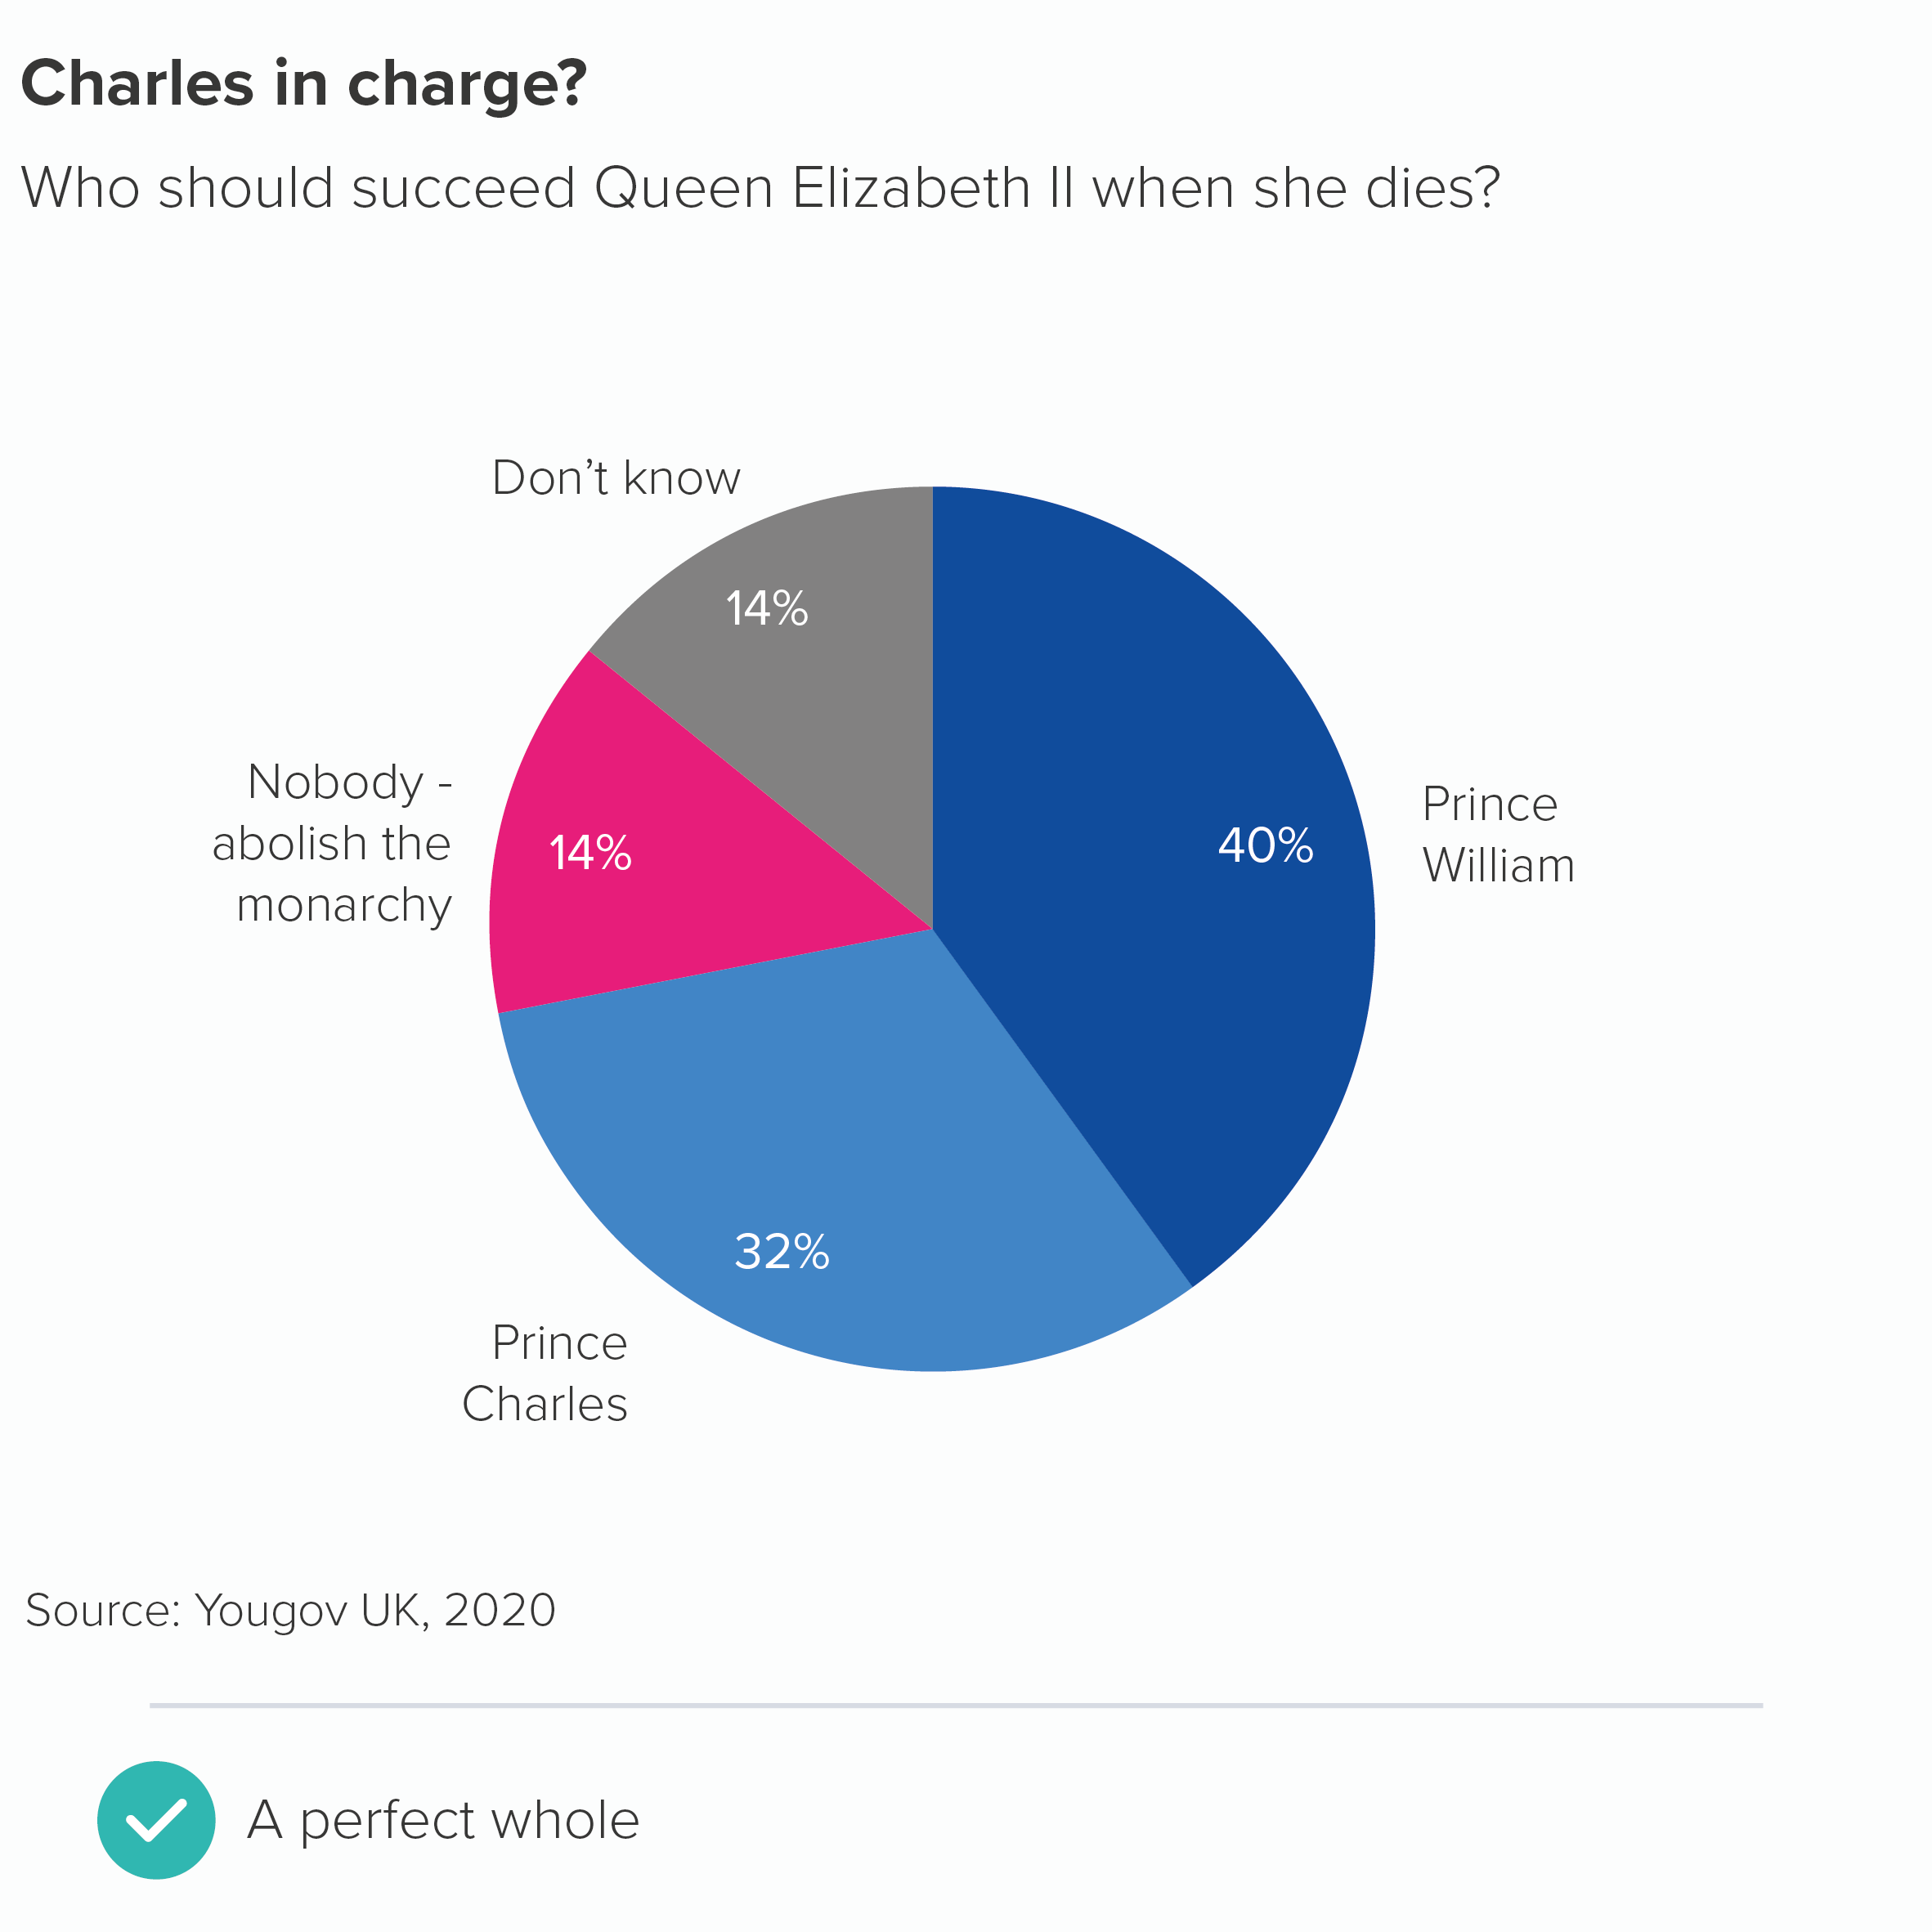
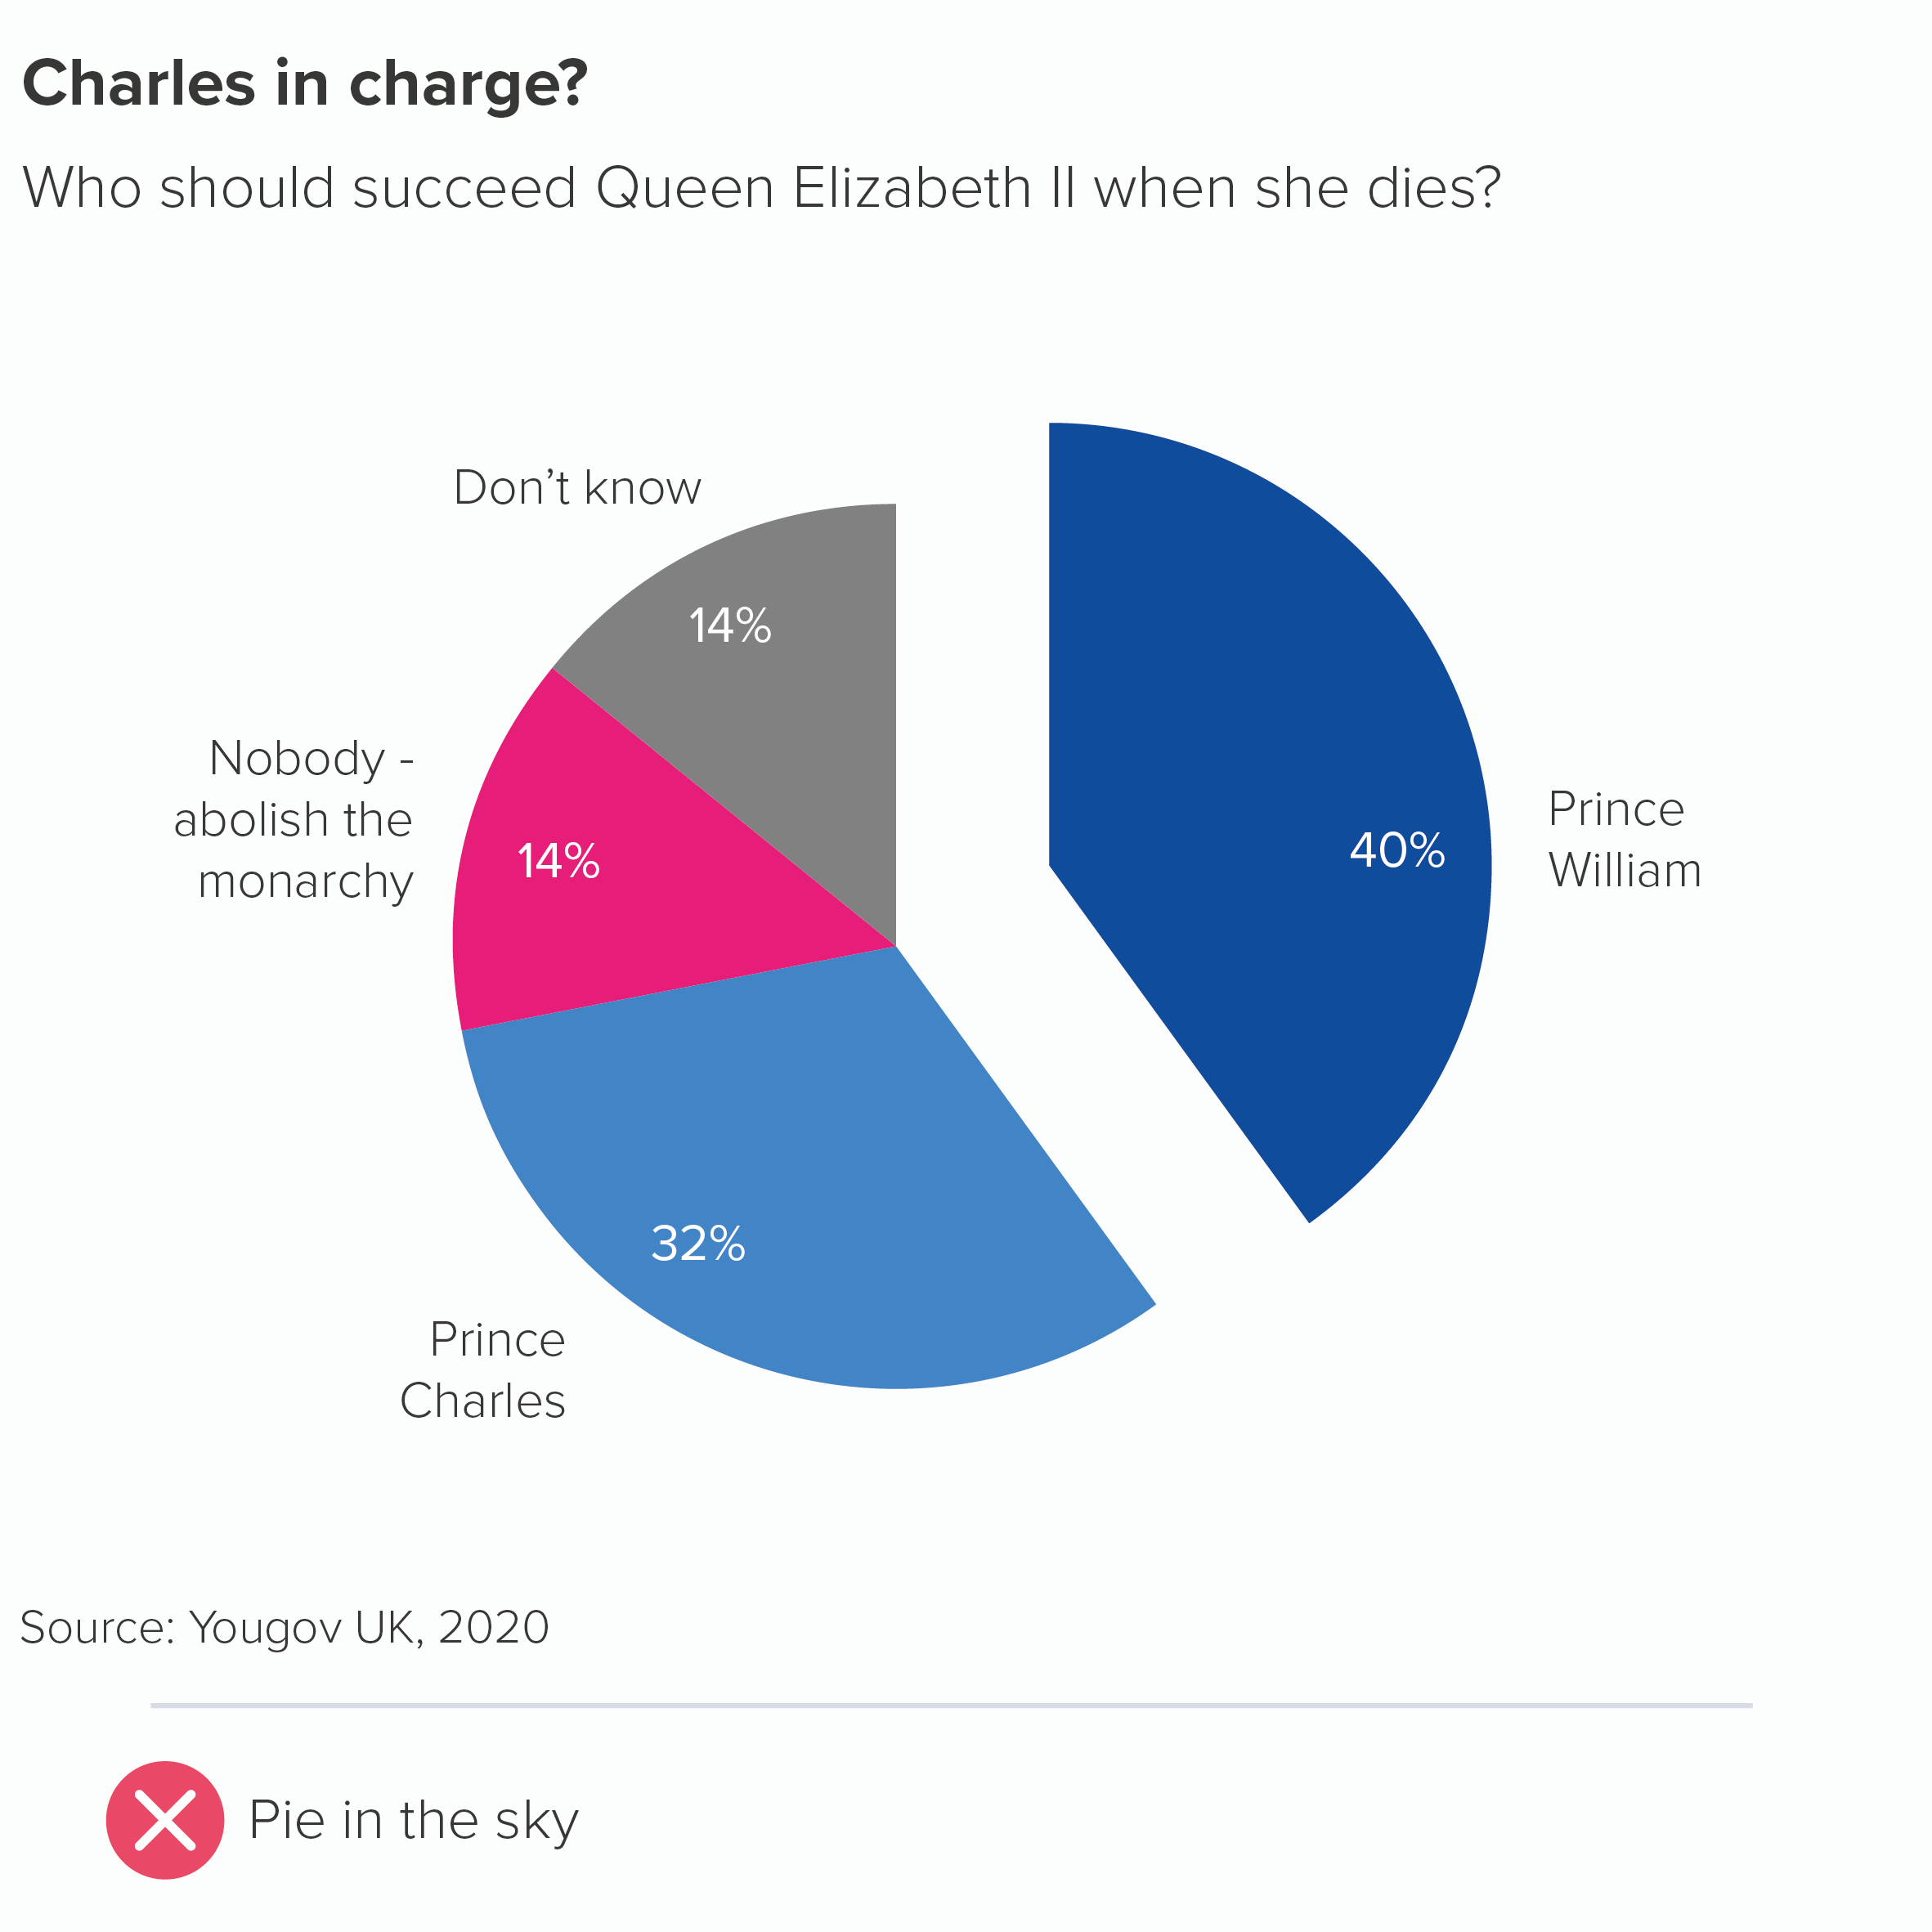
An exploding wedge appears to satisfy none of these criteria. By breaking a pie chart’s clockface shape, exploding one or more wedges makes the chart difficult to read. As for the story, the pie slices in themselves tell the story of dividing up a whole; pulling out one slice smacks of desperation, as if you were drawing a big ‘Notice this!’ arrow next to it. If you colour and label your wedges intelligently (we’ll cover this in rules 9 and 10), you shouldn’t need to signal so blatantly.
Finally, and I realise this may be just my personal taste, but I think exploding pies look gruesome. As I mentioned in the first rule, circles are the perfect shape; humans are hard-wired to love them. You had the chance to use this beautiful shape in your visualisation and you blew it. Or rather, you blew it up.
So I would say there is almost never a good reason for an exploding pie. Almost. The trouble is, some stories are about brokenness and breaking a perfect shape is a great way of making your audience see this. My favourite example: in 2012, Guardian designer Jenny Ridley took two halves of a circle to represent government incoming and outgoings. A red wedge juts outs to represent government borrowing. Its positioning and colour are perfect: it looks like something that has been clumsily hammered in to prevent the shape’s collapse: the keystone in a particularly rickety bridge. The system isn’t a stable one, so the chart isn’t either.
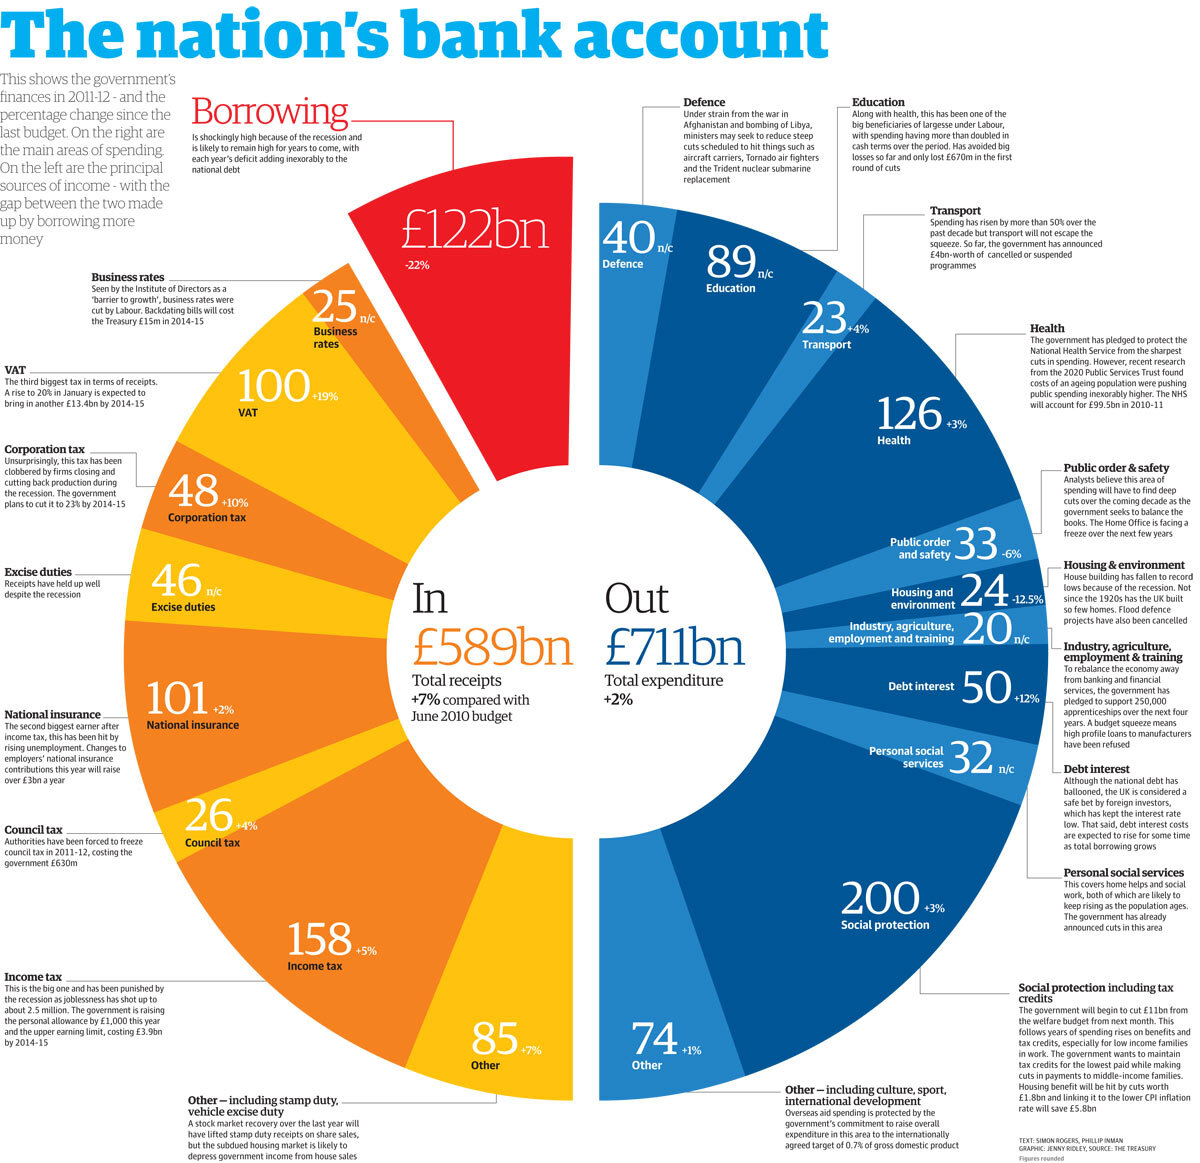
(And yes, I know this is a doughnut, not a pie chart, but the same principles apply in this instance).
Another example: sometimes you might want to suggest that one of the sections of your pie is no longer integrated into the whole.
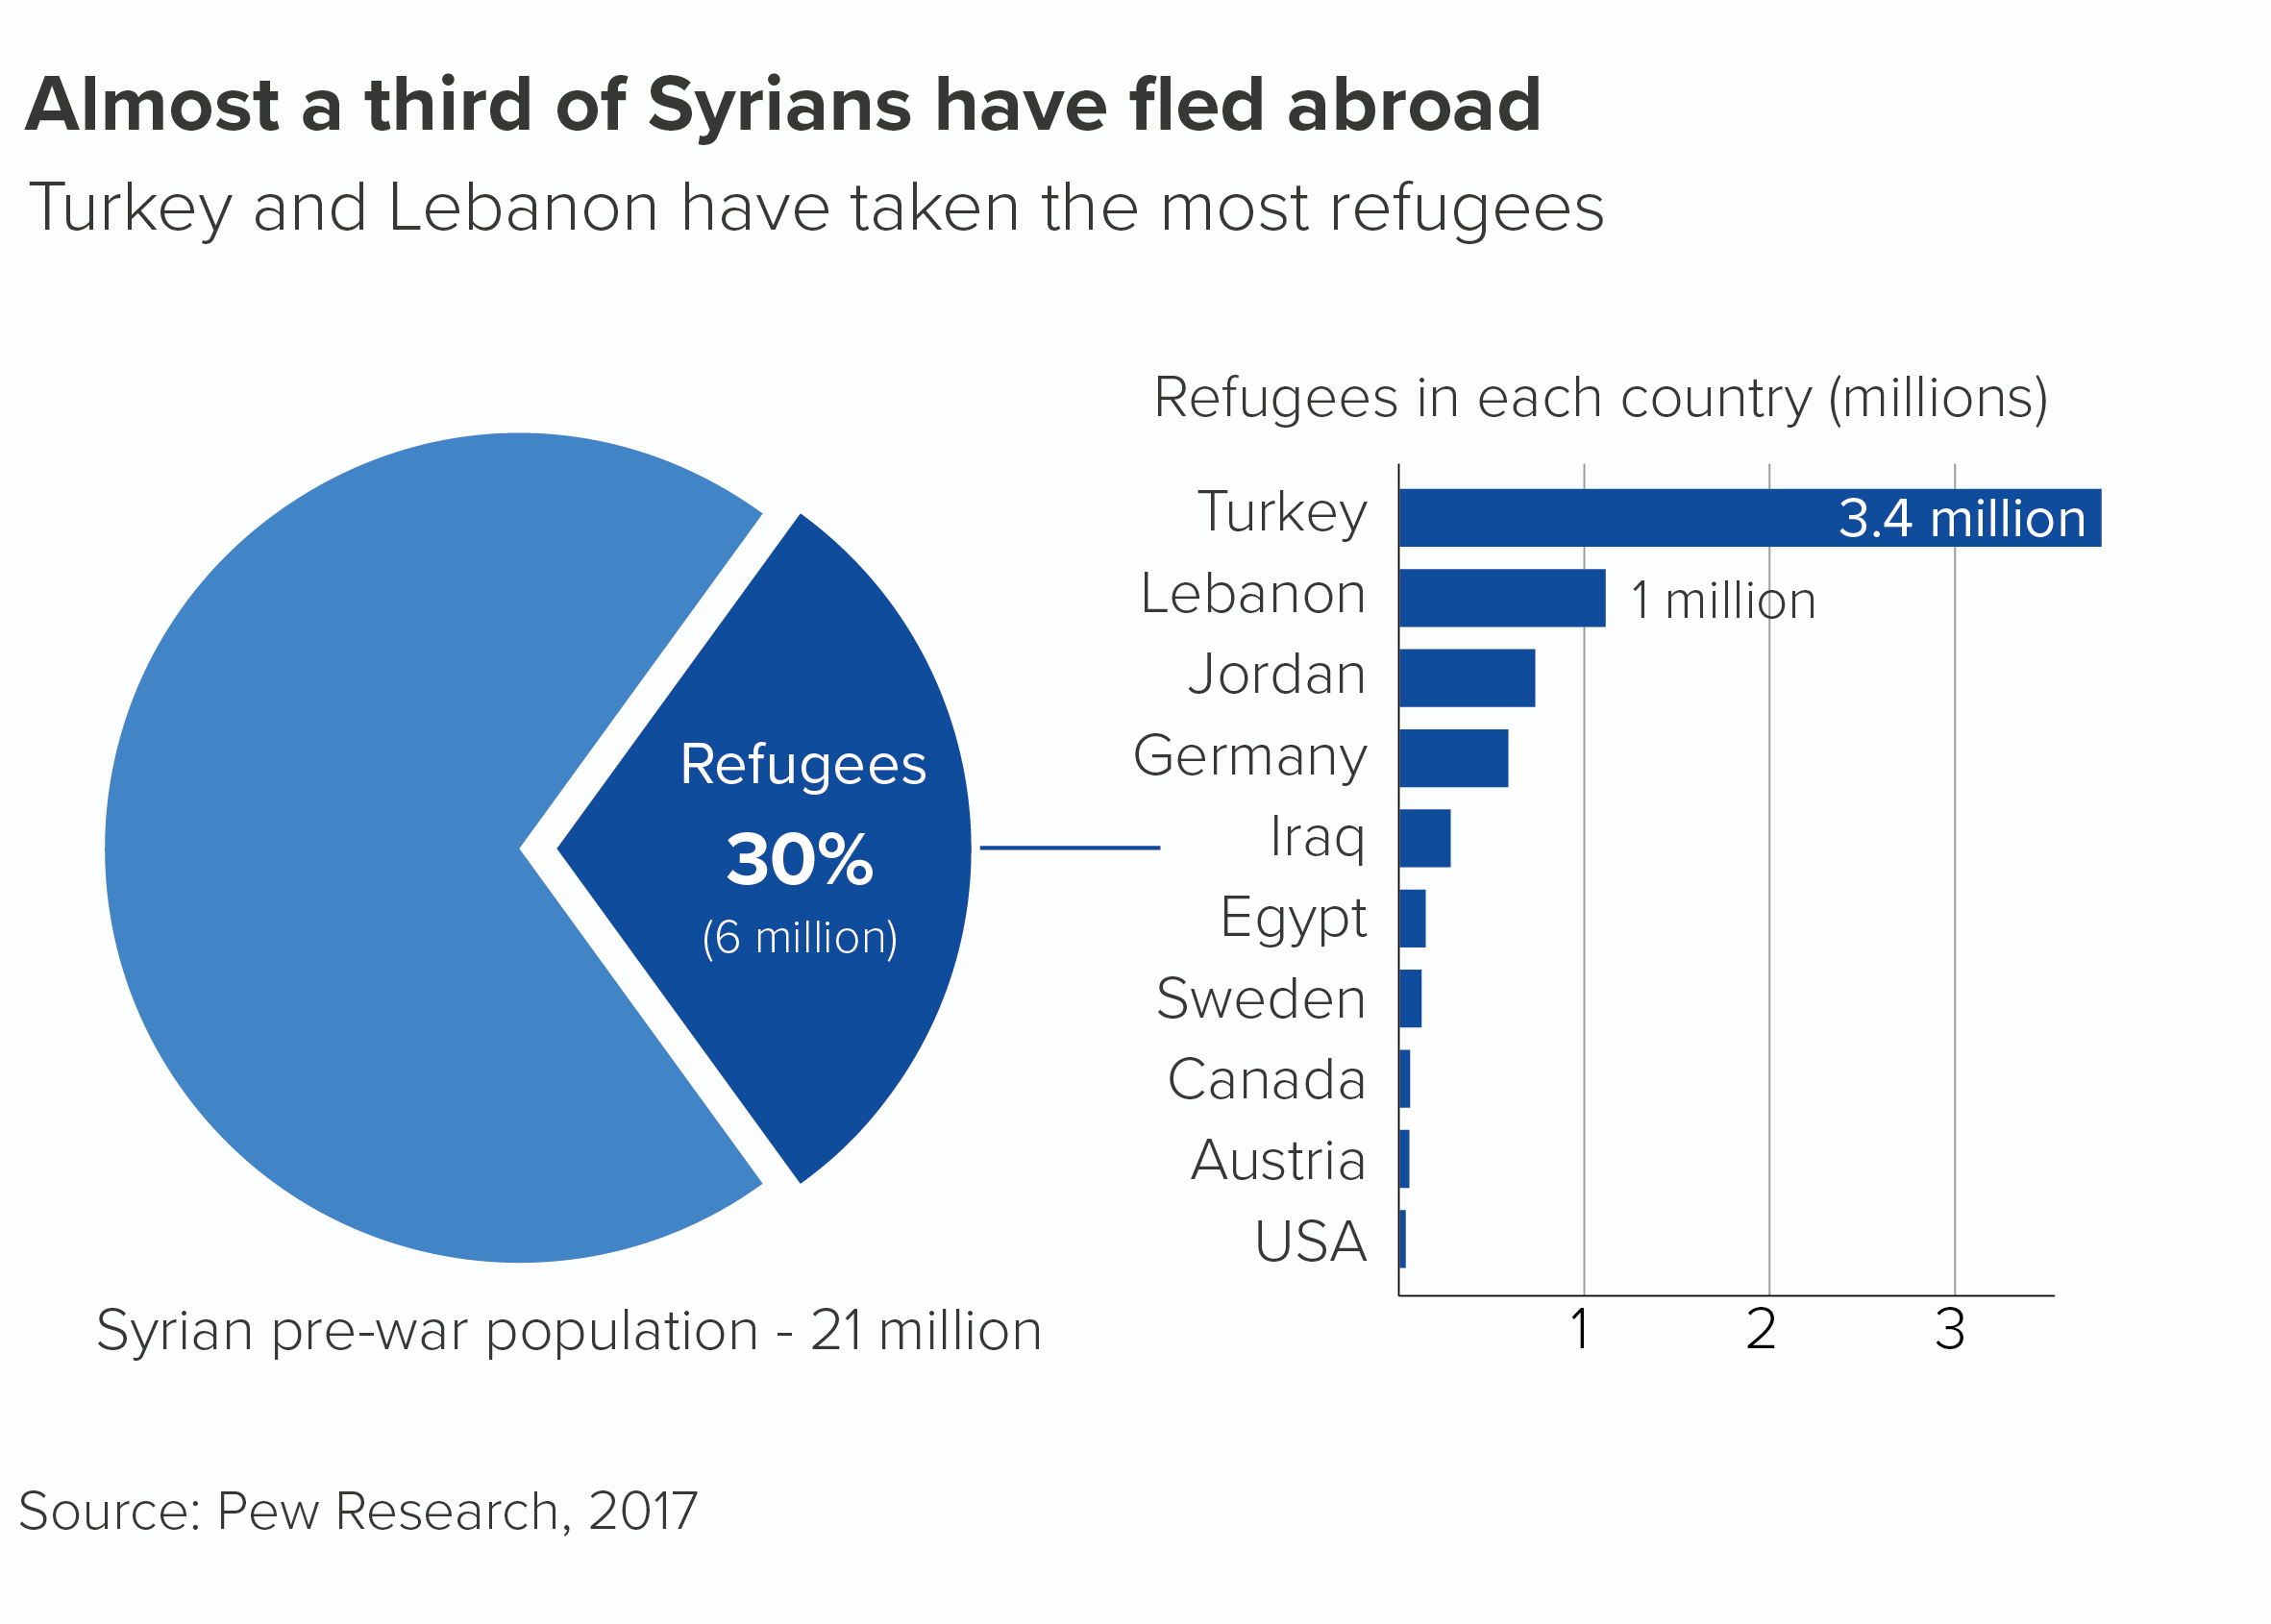
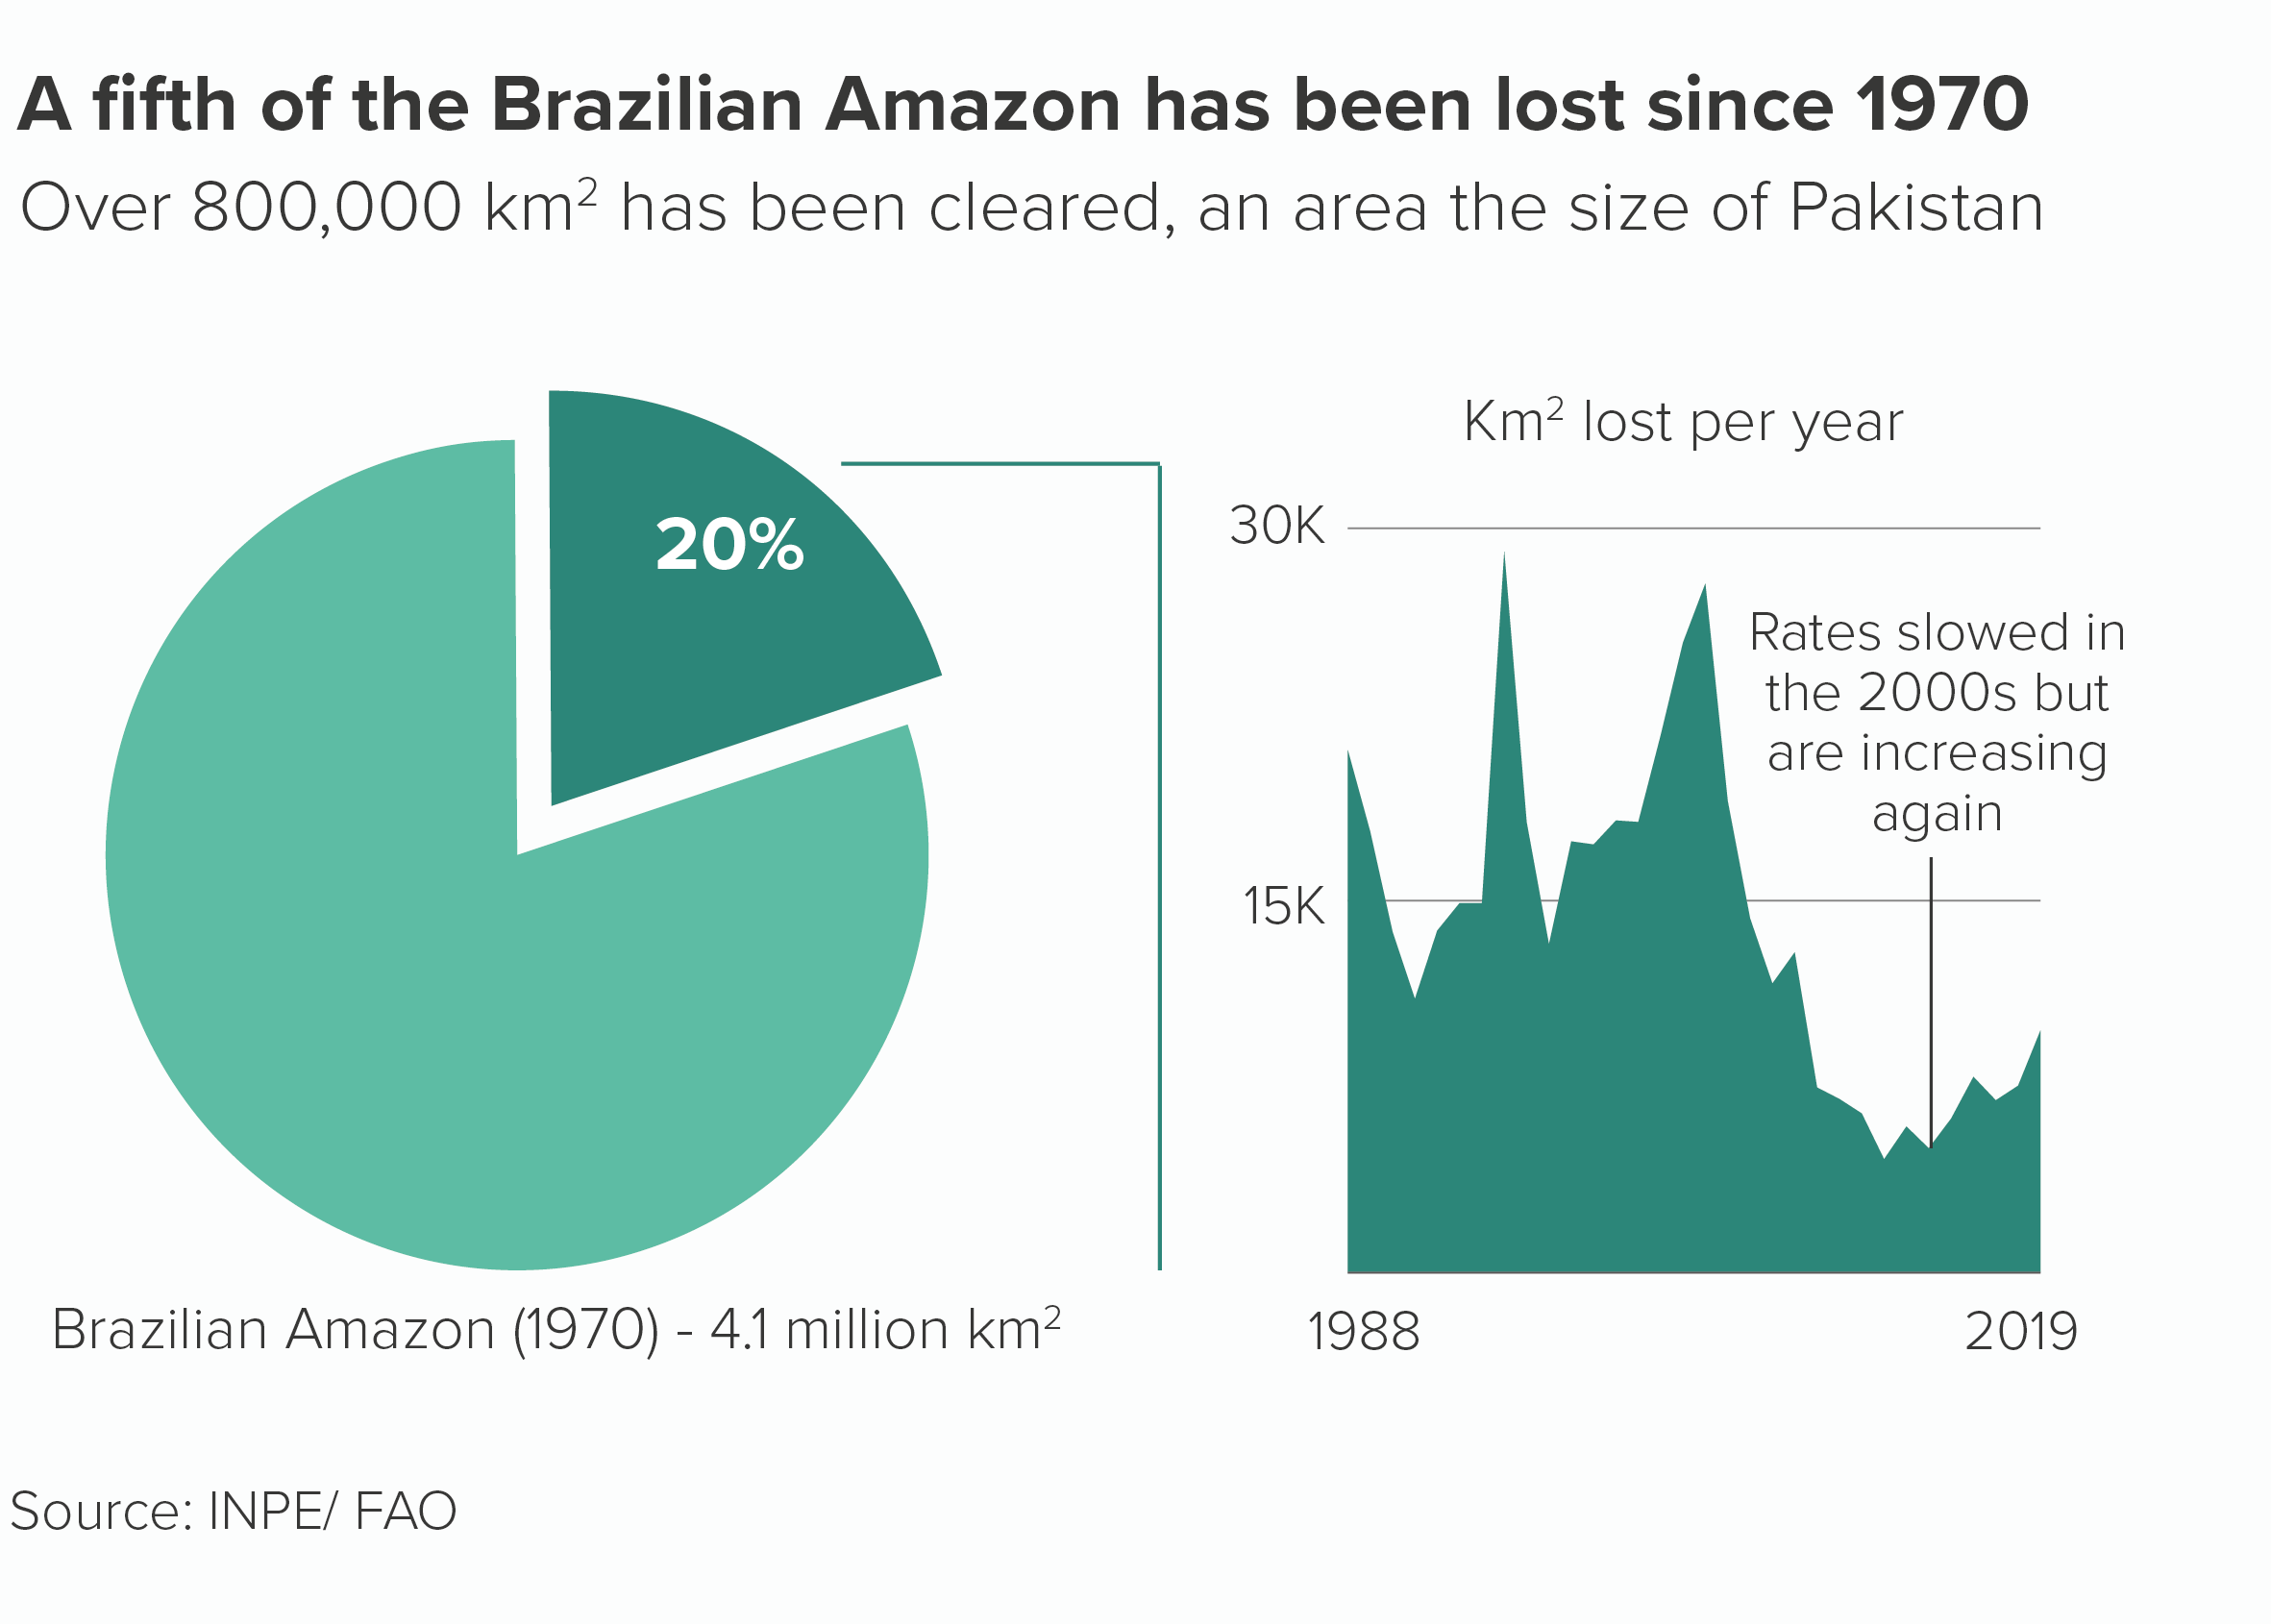
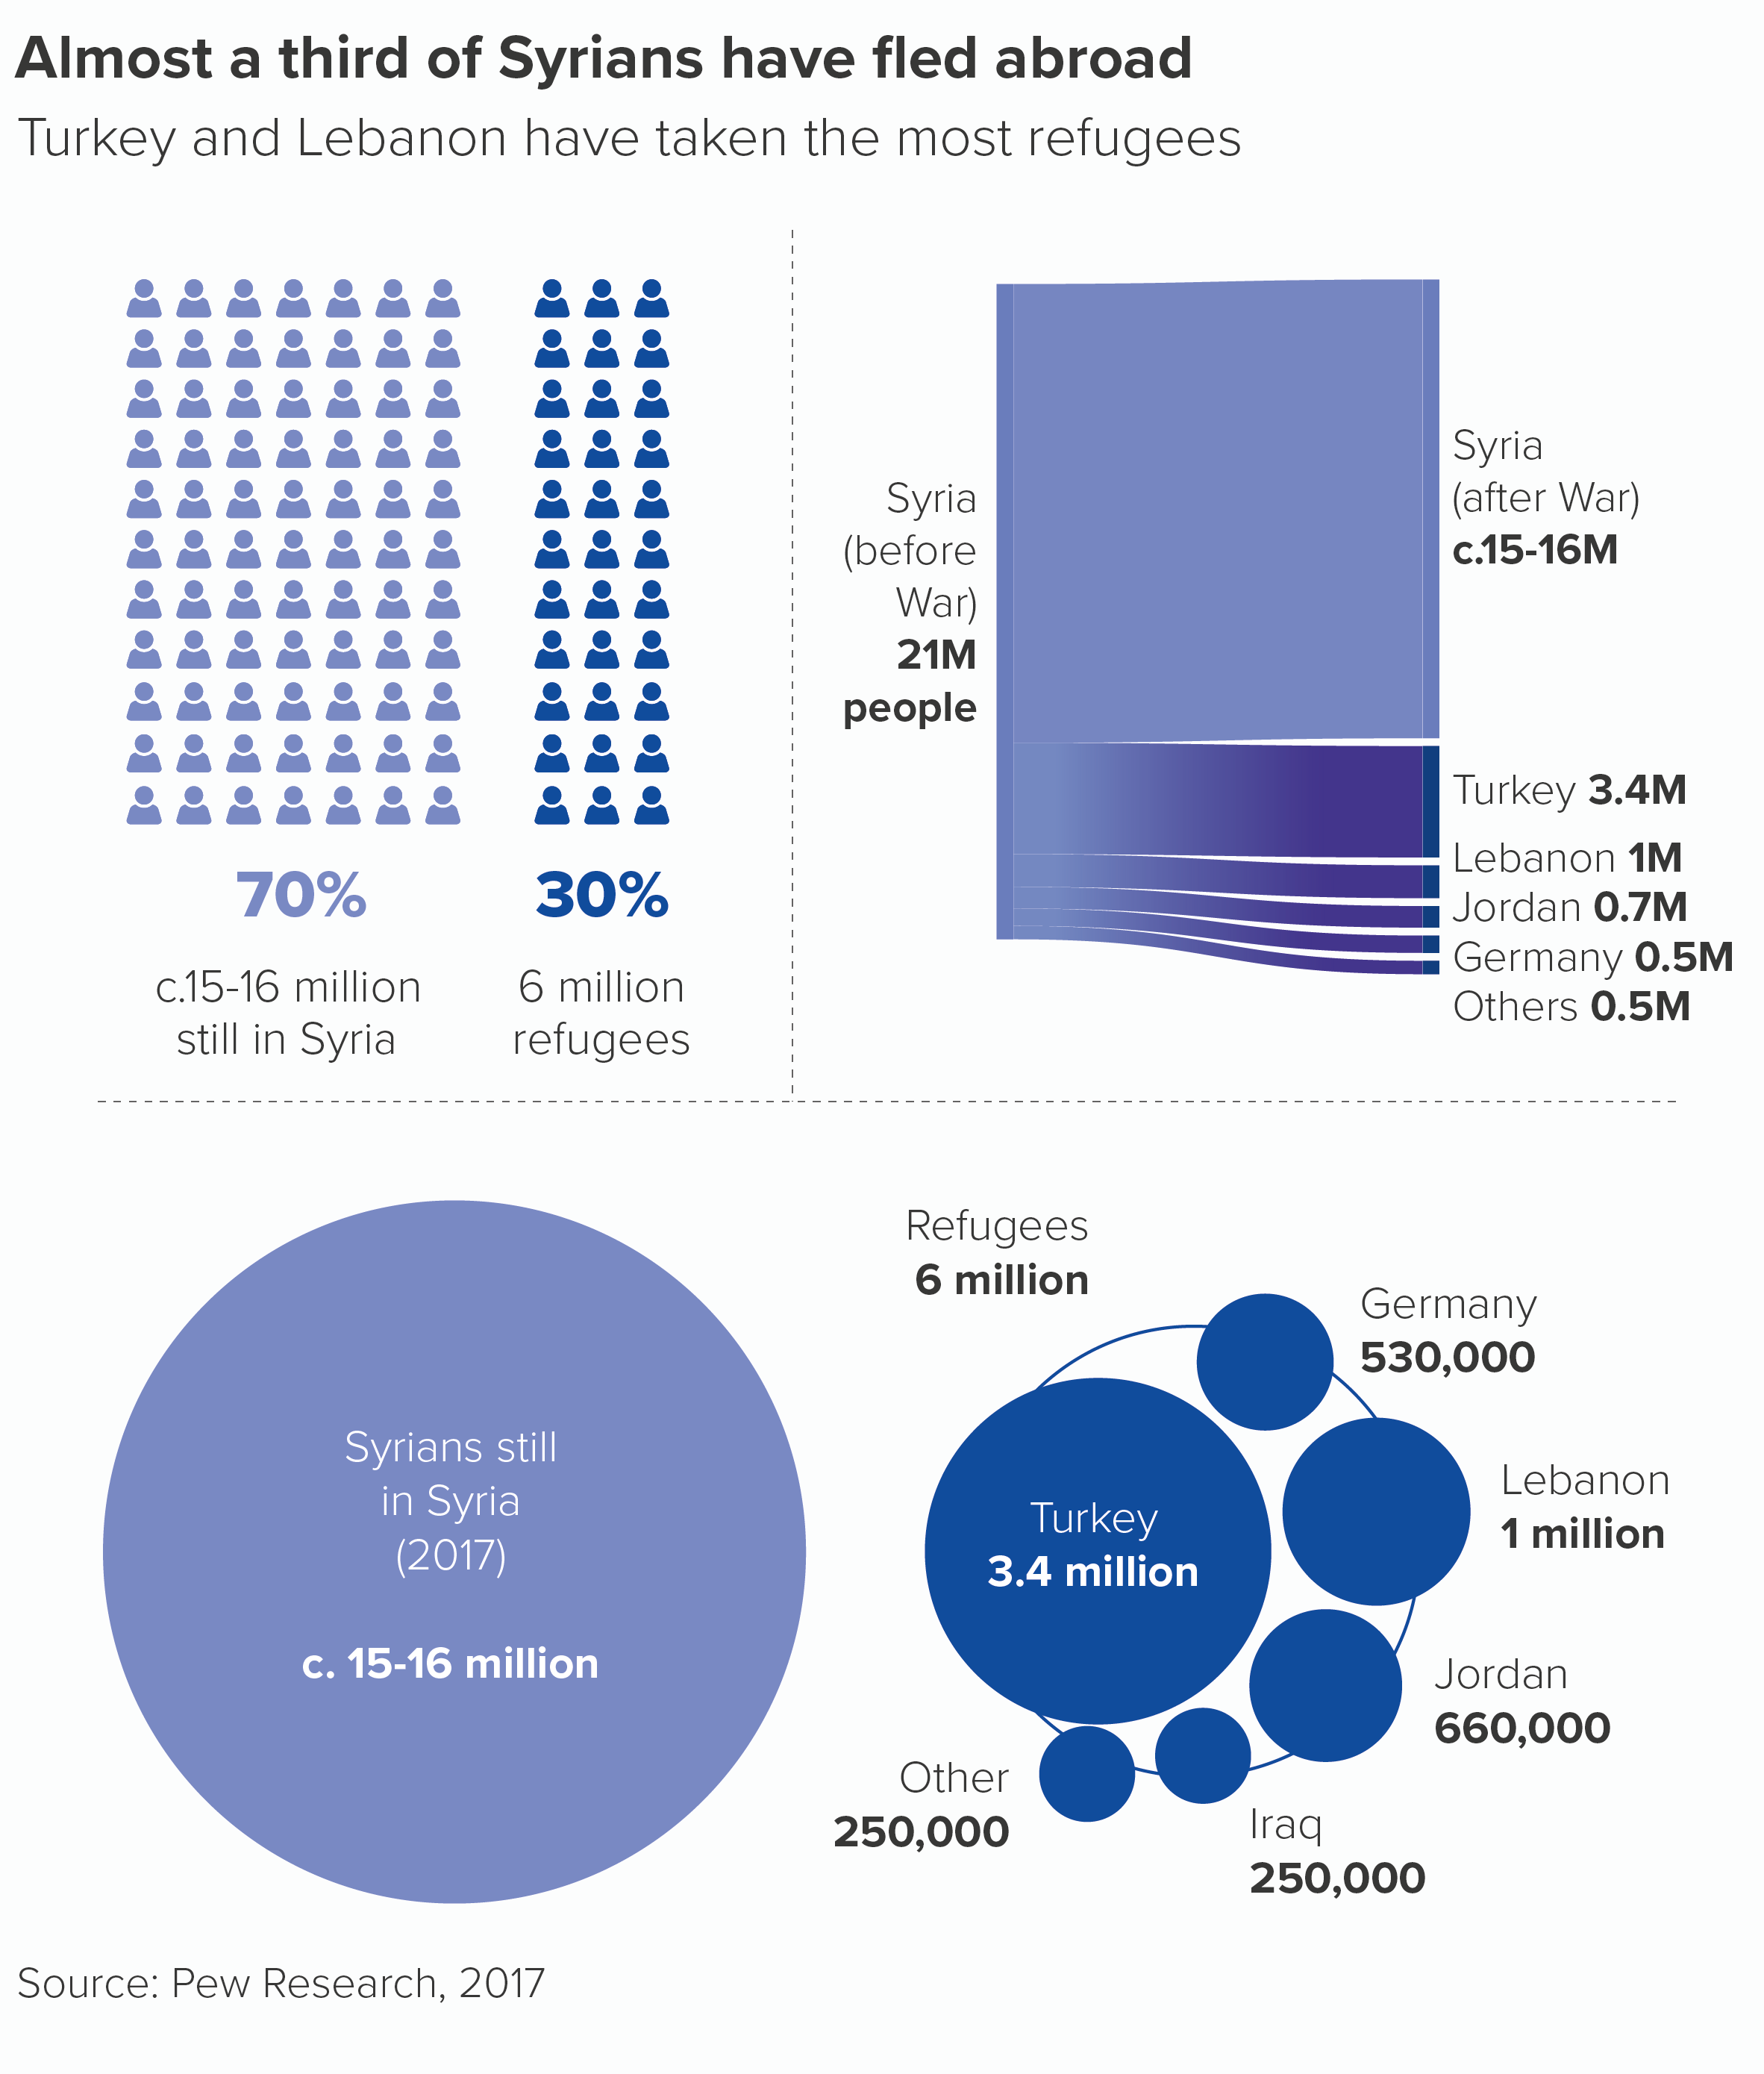
In the Syria example, we want the pie chart to represent a country that has been fractured. Many of those refugees will, after all, never return. In the Brazilian Amazon chart, we want to give a clear sense of the forest being ripped out of where it belongs.
Such stories aren’t common, but they do exist. And only when there is this perfect alignment of subject and chart would I risk a (controlled) explosion.
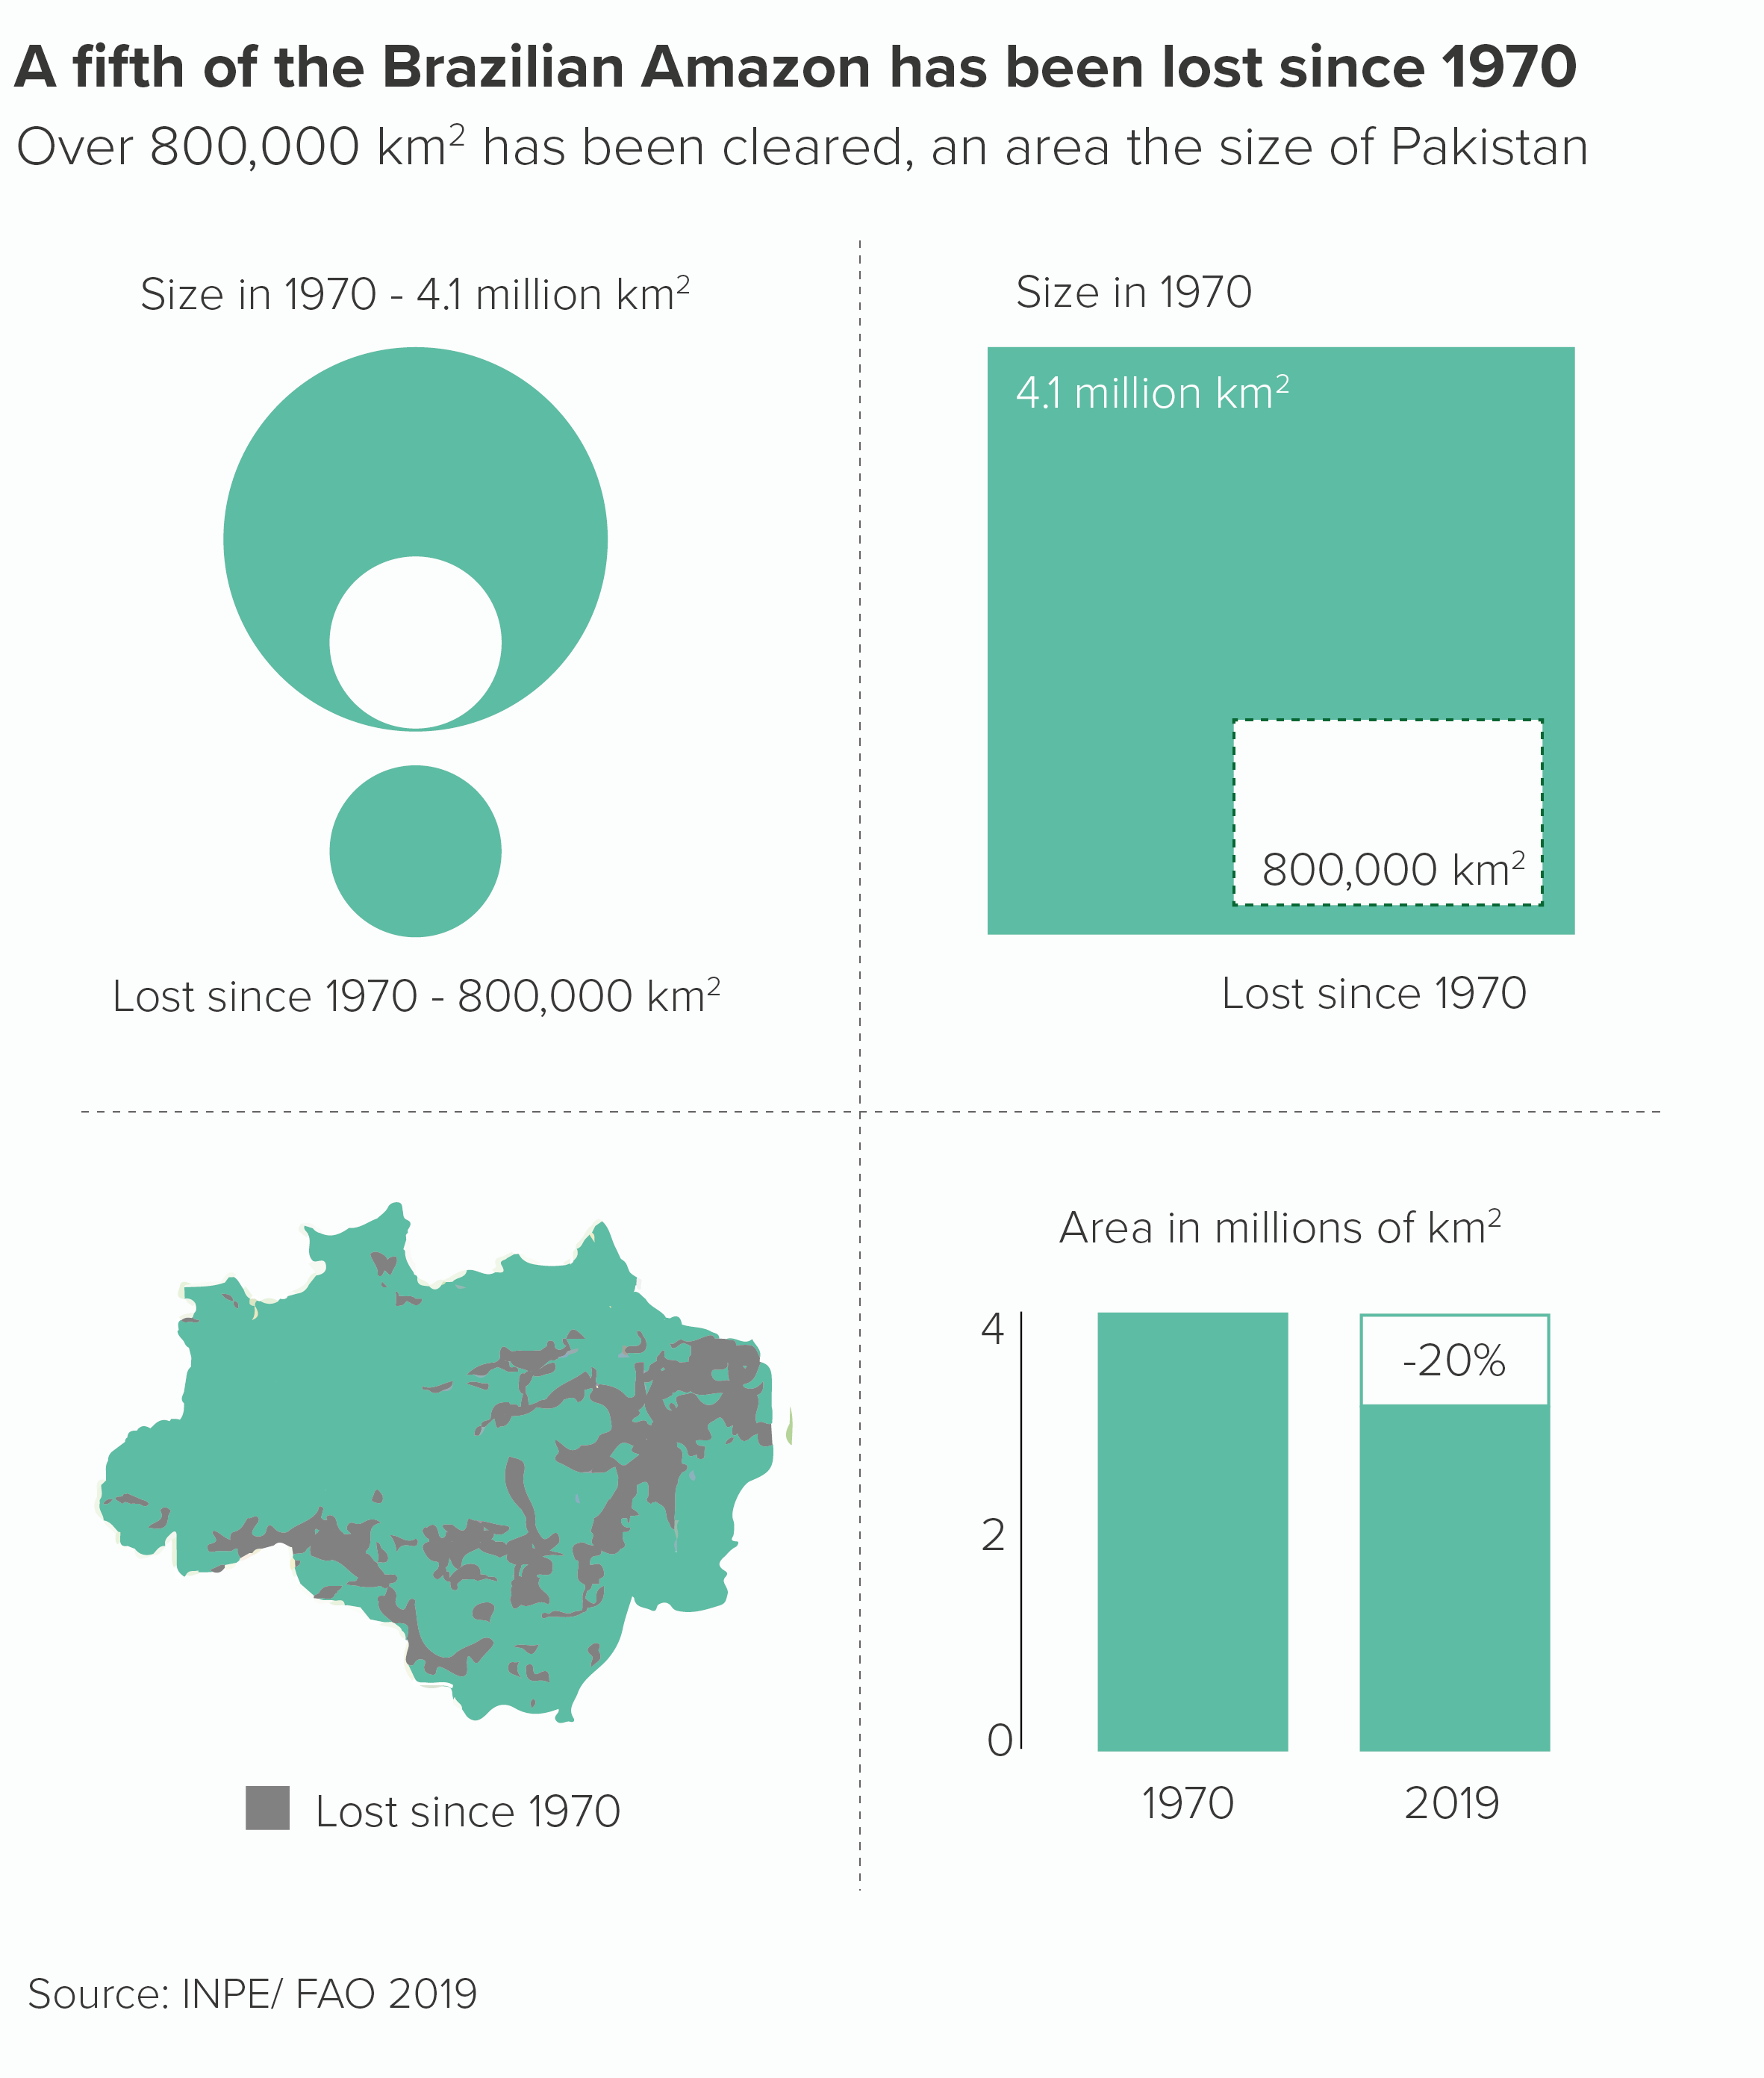
To be frank, even in these situations, I would always experiment with other visualisations too, because you might find that other visualisation types convey the idea of fracture in a more effective way than a pie. Here are some alternative versions.
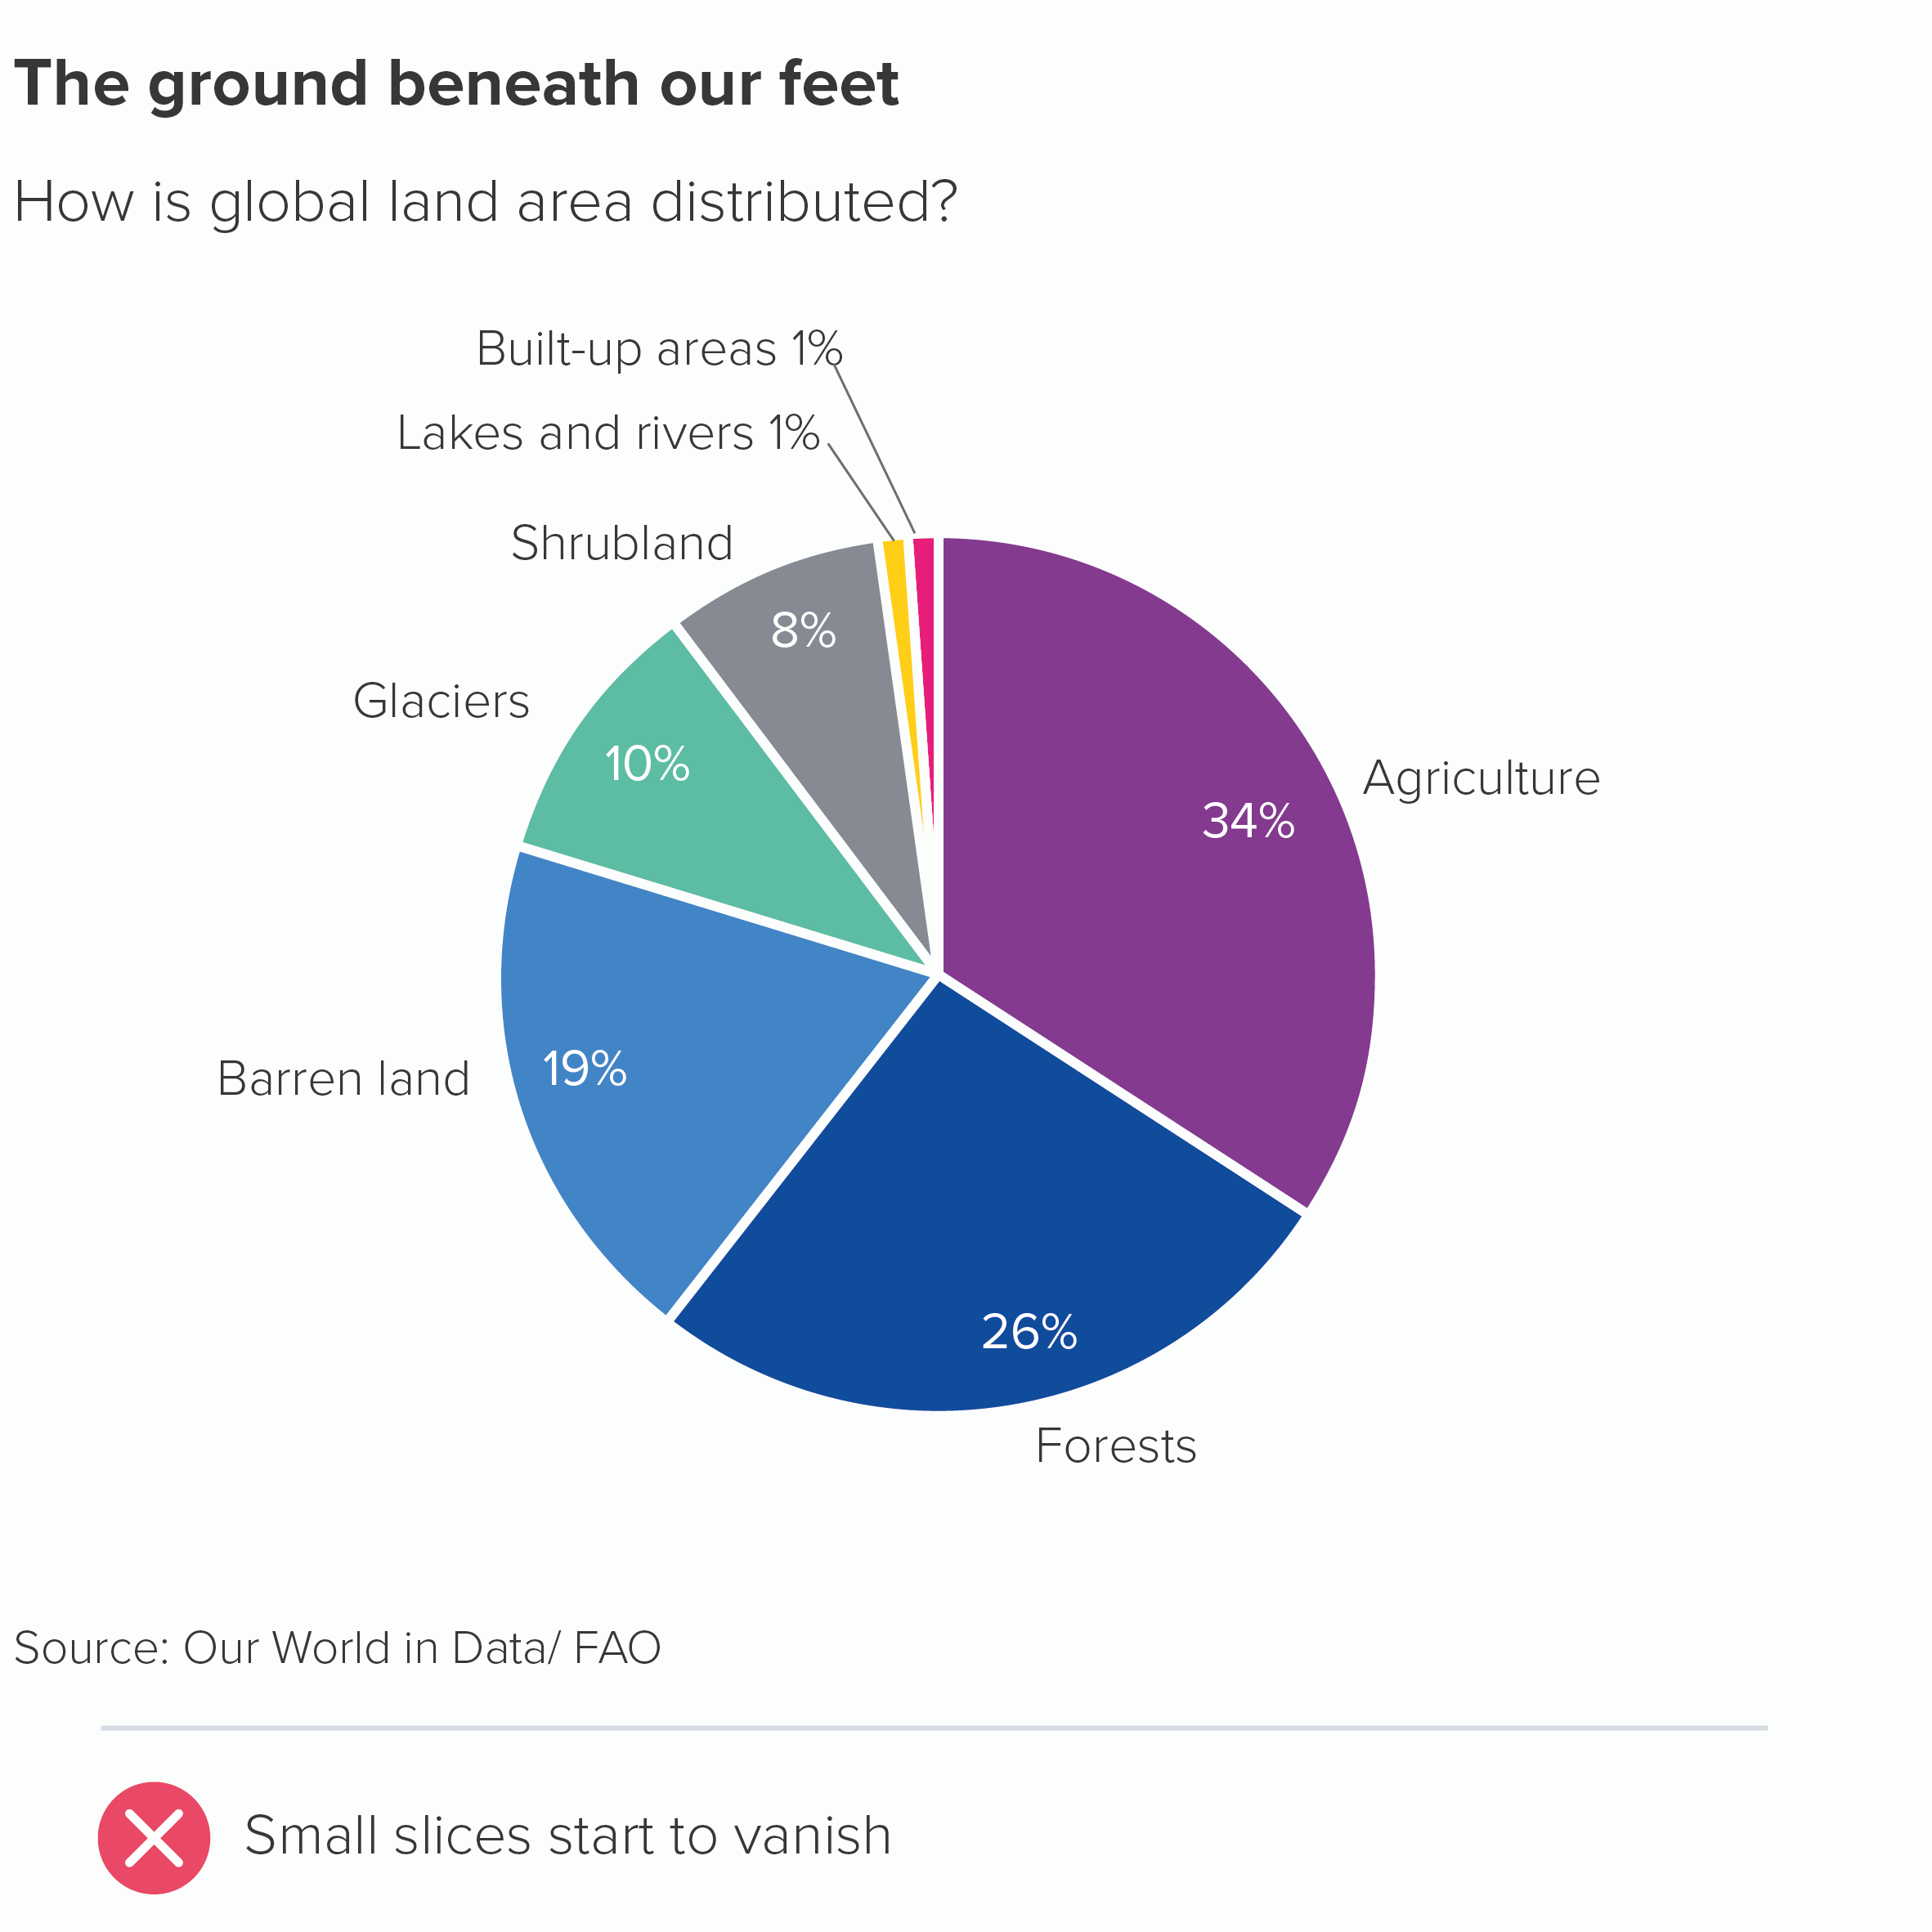
One additional note: a slightly less extreme alternative to exploding out a slice is leaving prominent gaps between your slices. You may have noticed that most of the good practice examples on this blog keep the wedges snug against each other. I have a slight preference for it on aesthetic grounds, and it’s more accurate too. Particularly when you have a bunch of smaller slices, a thick border can eat into the size of the wedge’s fill, leaving you with just slivers.
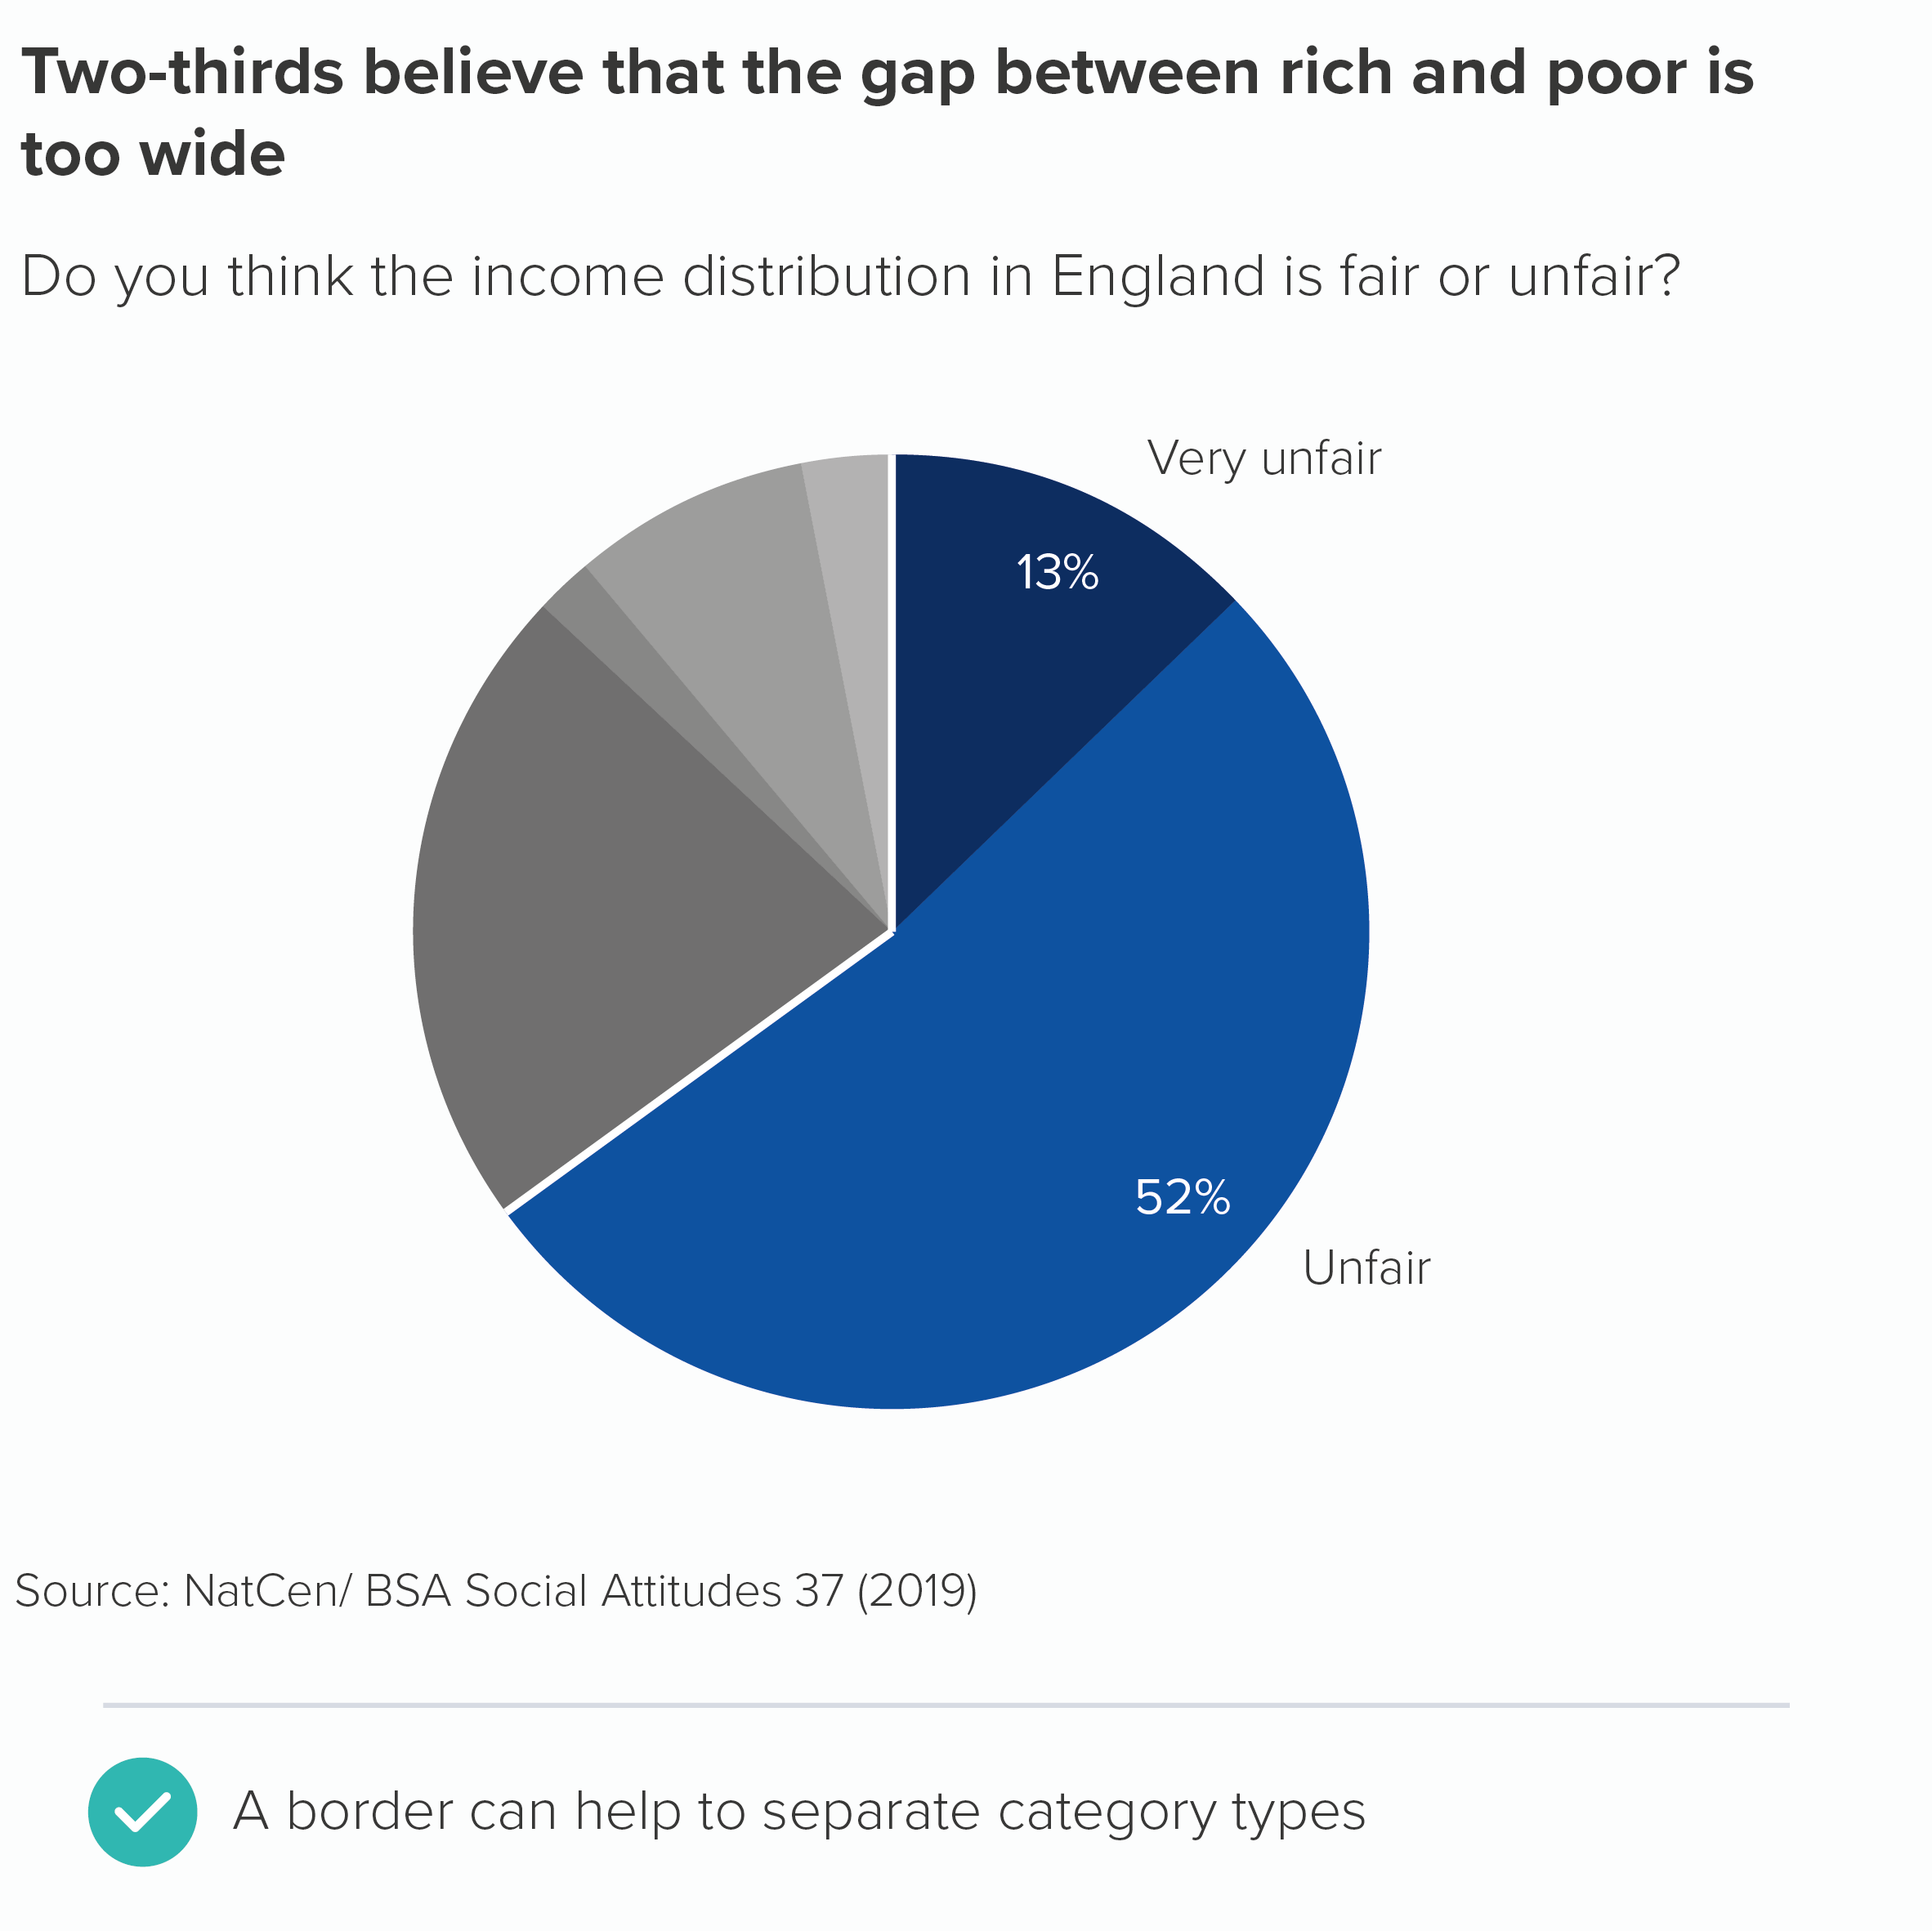
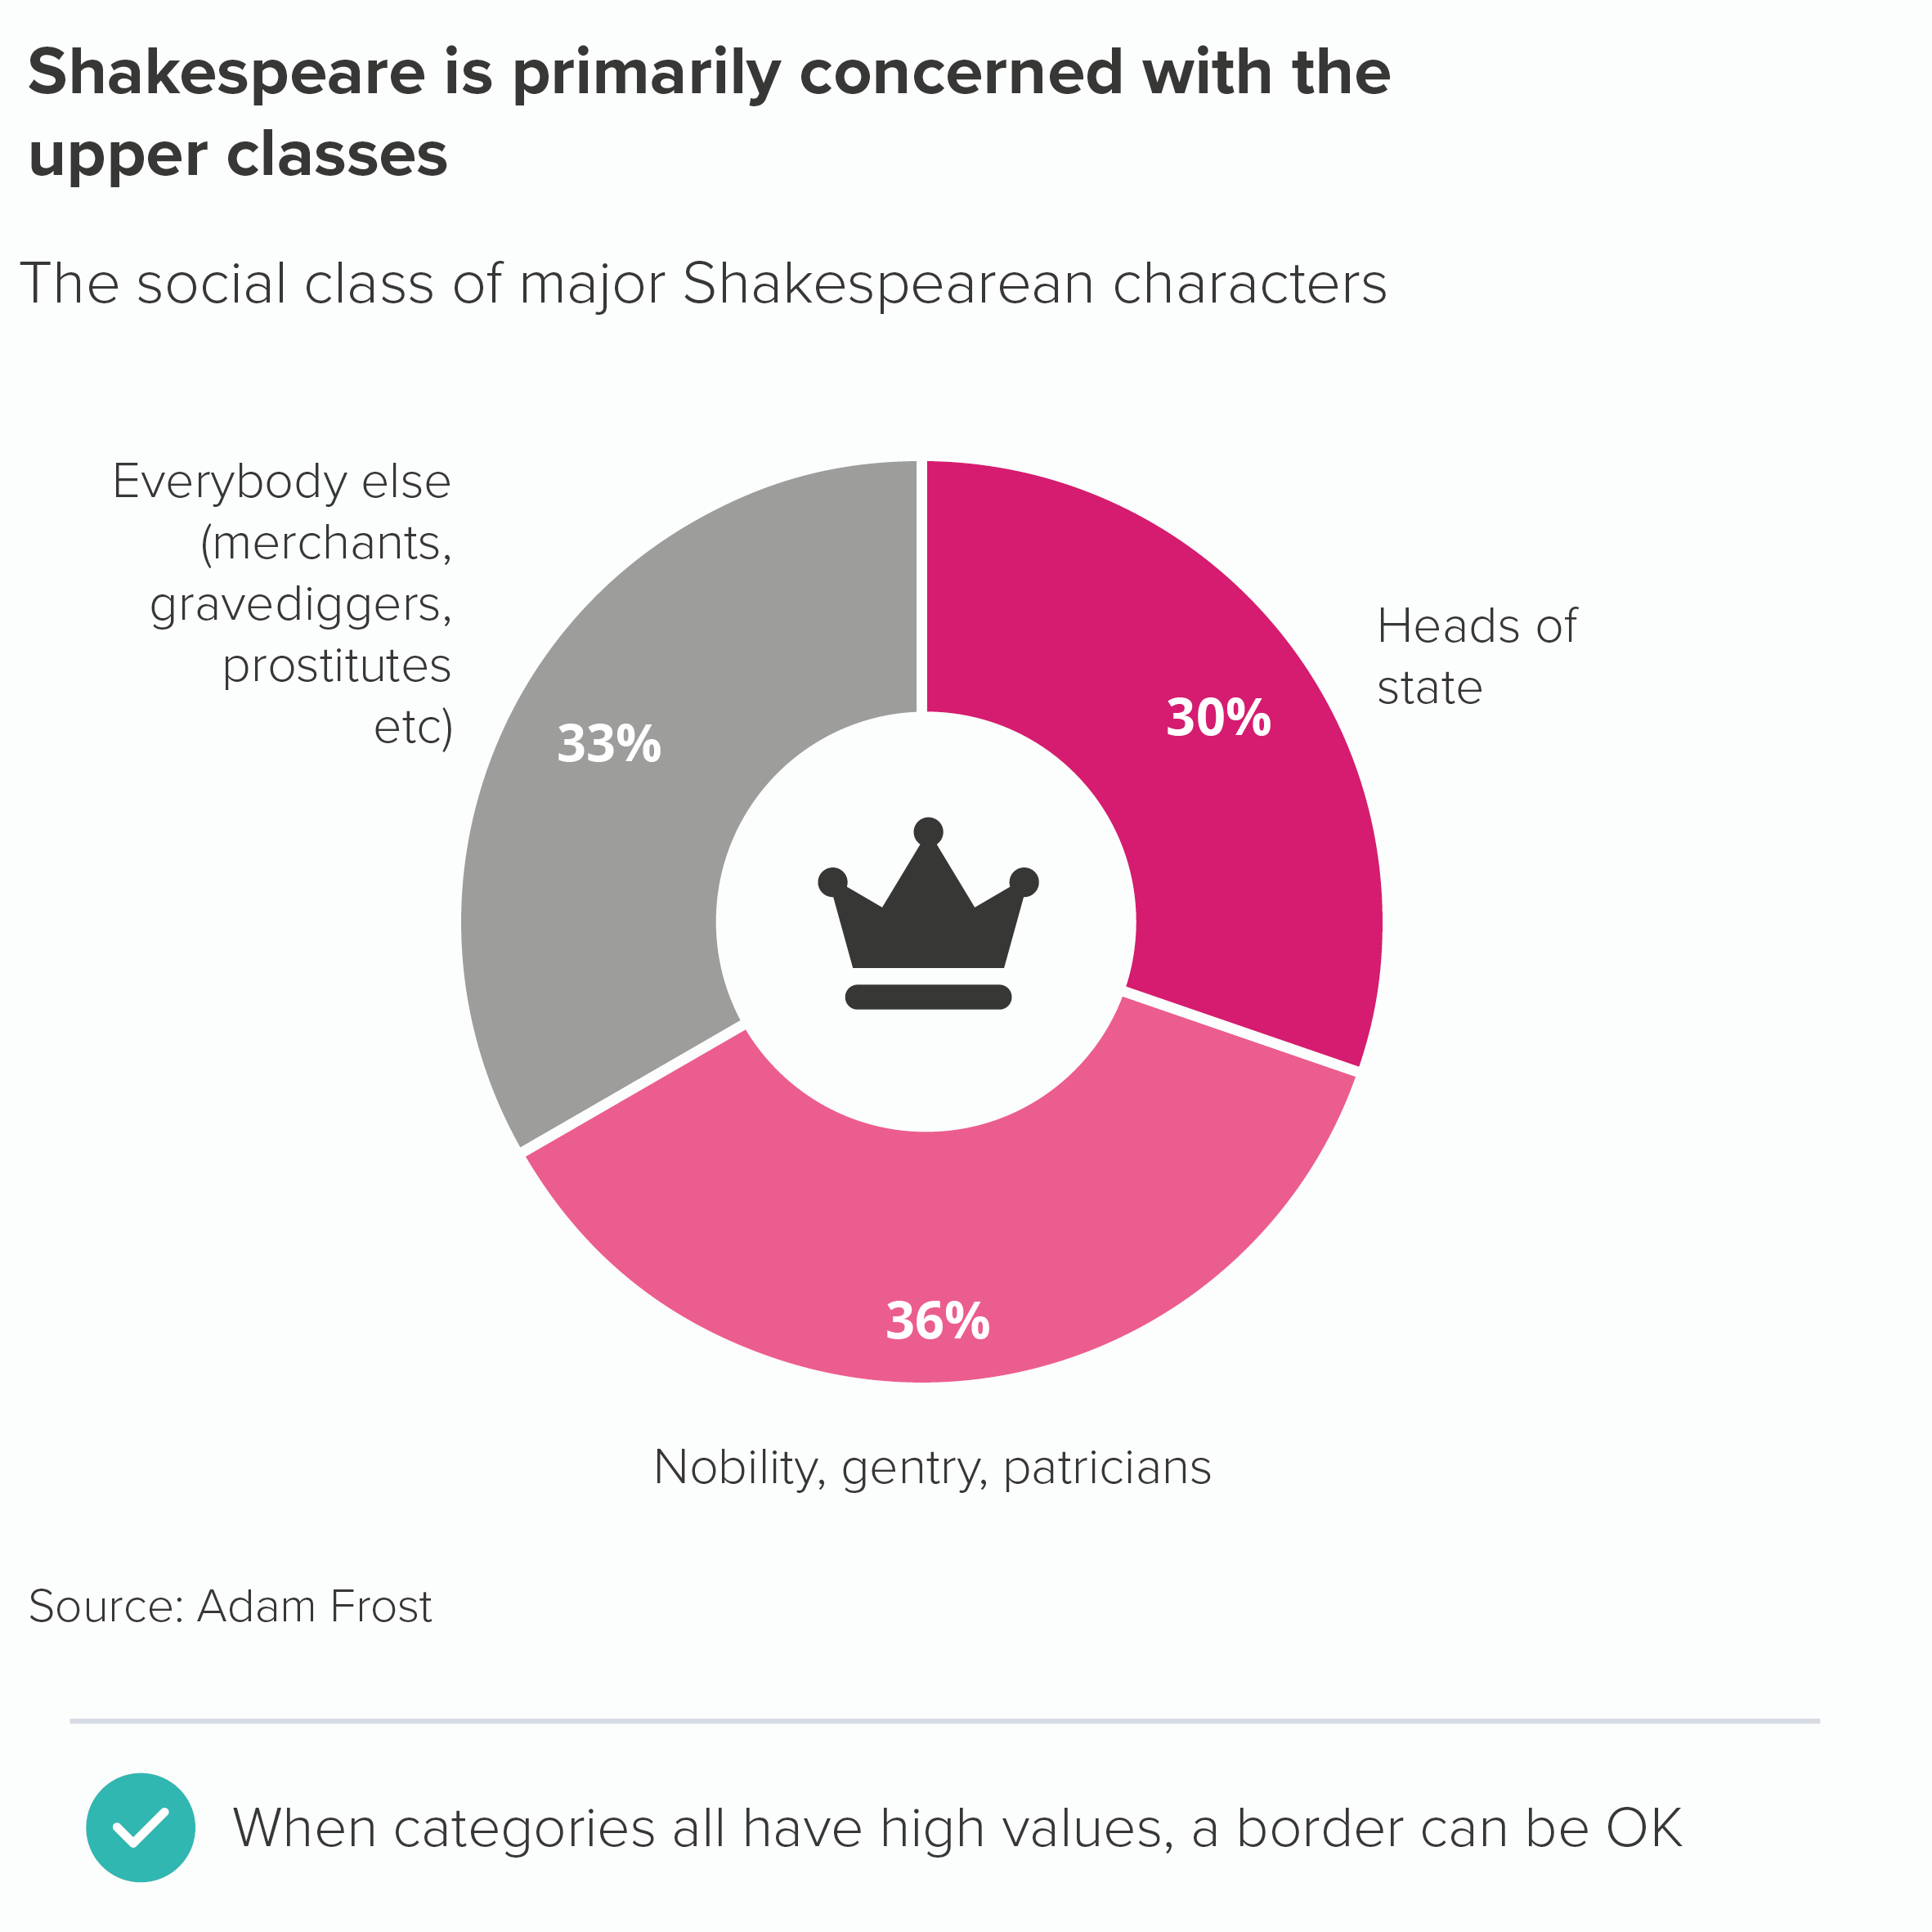
However, there can be valid reasons for adding a border. If you have a small number of categories, and they’re reasonably large values, then adding a border accentuates the fact that these are clear and distinct categories. This approach can work particularly well with doughnut charts. Likewise, a border can be a good way of signalling that there is a subgroup within your pie chart wedges.
Furthermore, sometimes you might want all but one of your slices to be the same colour. Take another look at the Guardian public spending example above - lots of yellow wedges for incomings, lots of blue wedges for outgoings. A subtle white border is crucial for distinguishing between the slices.
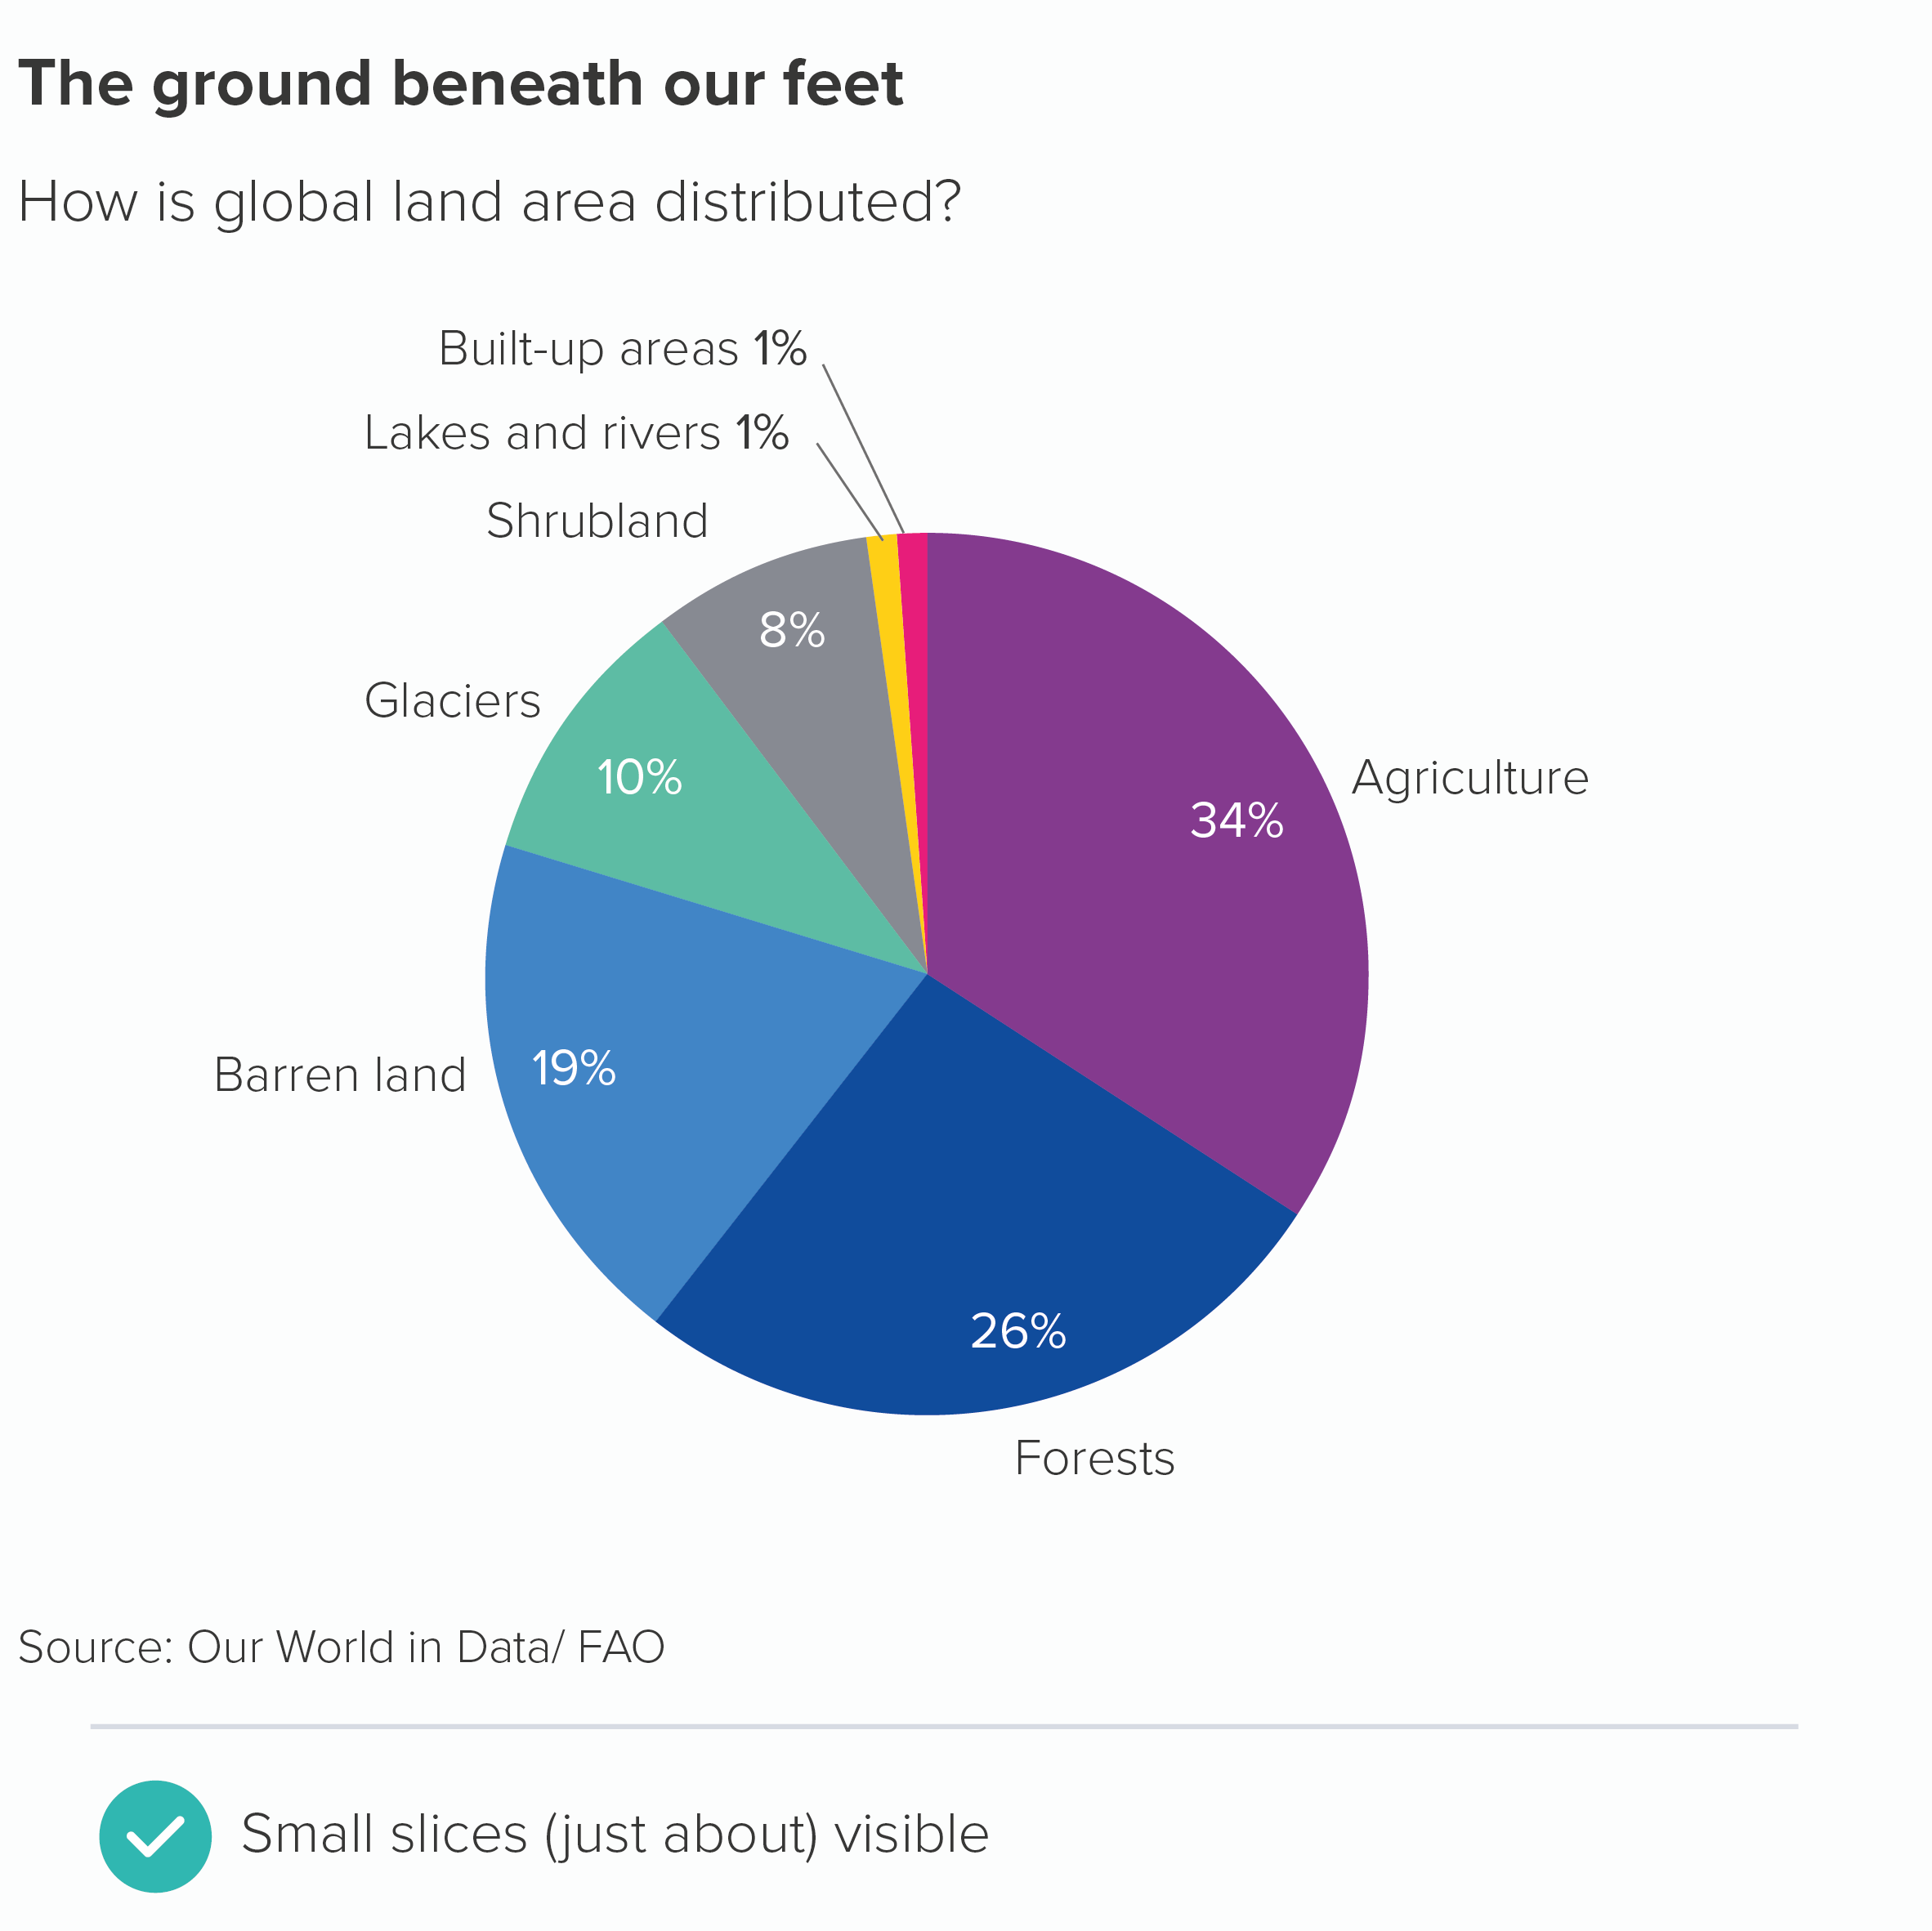
In fact, occasionally you might want all your slices to be the same colour. This is usually when the pie is showing a second-level composition story or it is part of a more detailed infographic where the same colour is used throughout to create narrative consistency and visual harmony. In these cases, a white border between the pie slices is, of course, essential.
VERDICT: Only explode a pie if the story absolutely requires it
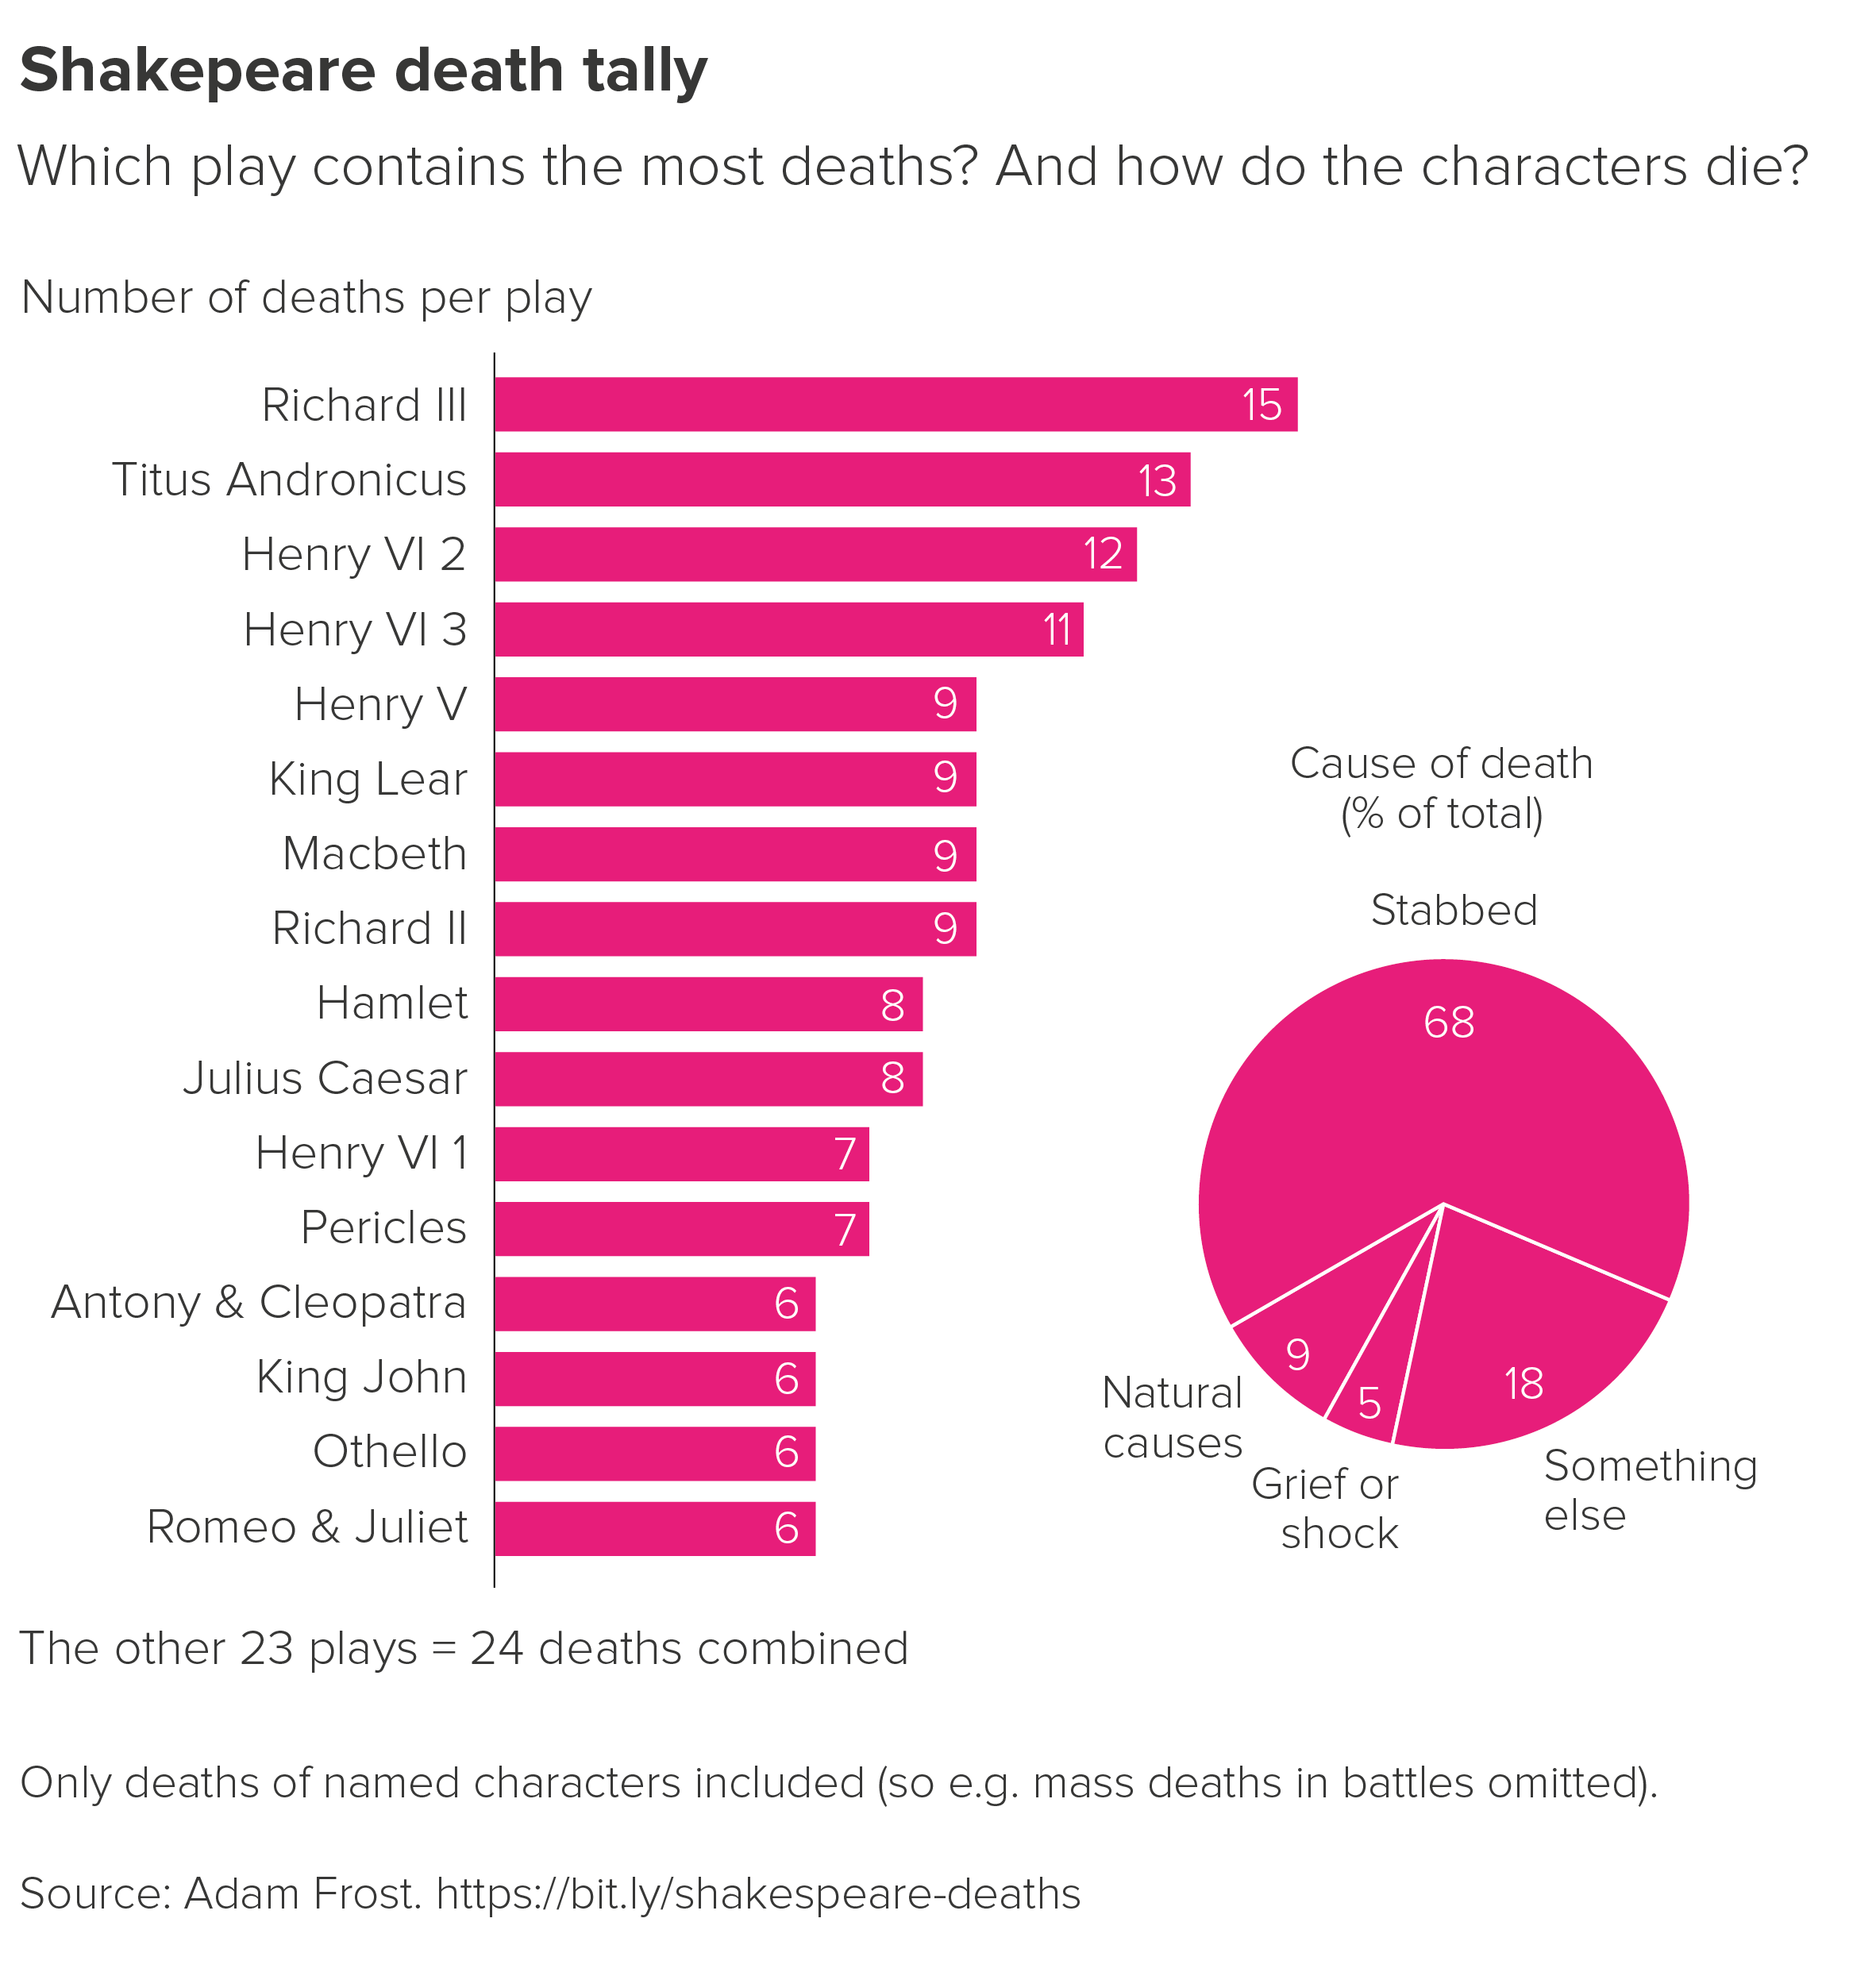
Sources: Yougov data on who should succeed Queen Elizabeth II?, Pew Research data on Syrian refugees, Amazon data from INPE/FAO, global land distribution data from FAO via land use page on Our World in Data, income distribution data from NatCen BSA 37, Shakespeare class and death data compiled by Adam Frost
More data viz advice and best practice examples in our book- Communicating with Data Visualisation: A Practical Guide